November 4, 2026
5 min read

Extreme Daily Falls in 5 of Our 87 ETFs, 30 October 2026

5 Extreme Falls. The ETFs That Fell on Such Days Since 2011 Returned a Median +10.7% Over the Next Year, Against +11.0% After Ordinary Dates

On 30 October 2026, five of our 87 ETFs had extreme daily falls. South Korea (EWY) fell 5.52% on the day, Technology (XLK) fell 4.89%, Momentum Factor (MTUM) fell 4.77%, and Taiwan (EWT) fell 4.60%. The last date with as many was 23 September 2026.

What an extreme day is
Each ETF is measured against its own history. An extreme day is a daily return among the lowest 1% or the highest 1% of its returns over the previous ten years. That is about 2.5 trading days a year on each side.
The threshold differs from one ETF to the next. On 30 October 2026, a fall of 3.47% was extreme for Gold (GLD); South Korea (EWY) had an extreme fall at −5.52%.
Why it matters
Across our ETFs as a whole, the median year after a date with extreme falls was +11.1% when under 2% of our ETFs had one, +12.0% at 2% to 10%, and +14.7% at 10% or more (80 dates in 23 episodes). After the dates with none, it was +10.6% (2011 to September 2025). On 30 October 2026, 5.7% of our ETFs had an extreme fall.
The ETFs that had the extreme falls did no better. Counted once per date, they returned a median +10.7% over the next year, against +11.0% after an ordinary date, across the 370 dates with an extreme fall since 2011.
At 2% to 10% of our ETFs, the middle 80% of the years after ran from −6.3% to +26.5%. One date says little about the year that follows it.
Our full study, What Followed the Market's Worst and Best Days, measures both readings ETF by ETF and by asset class, and what adding money on those days did to a monthly plan.

The Day's Moves in Context

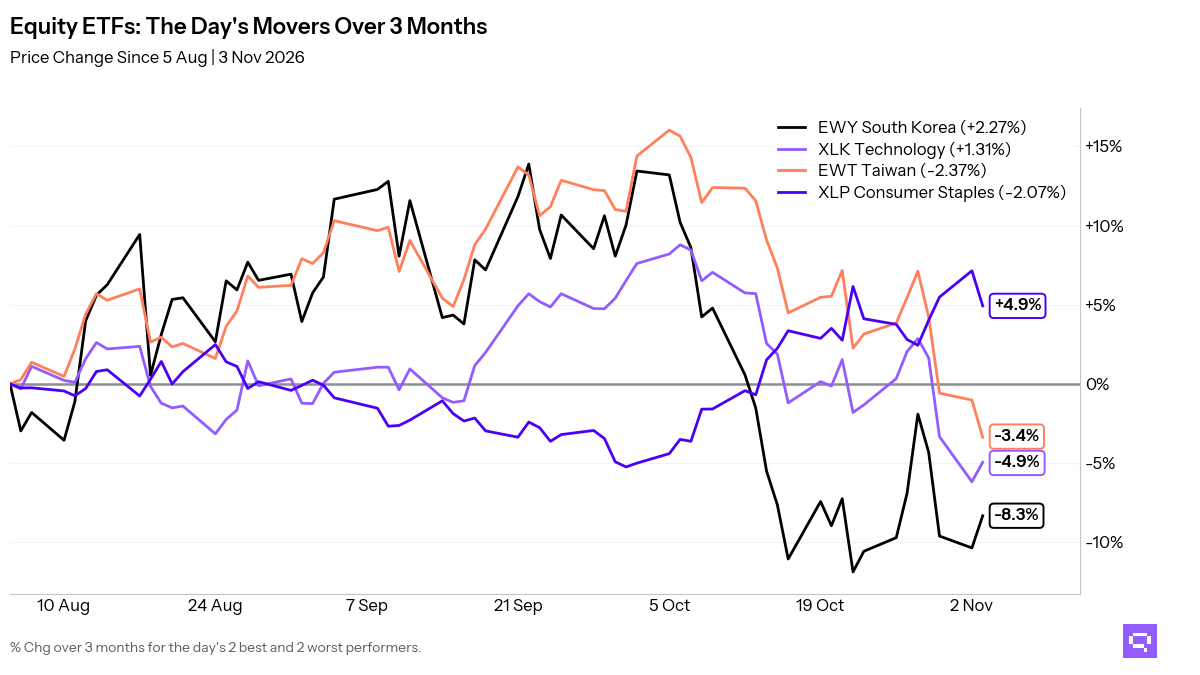
The first chart shows the four largest of the five falls over the past three months. The one-year candlestick charts below it show the three largest of the five falls, each with its 20-day moving average. The table further down lists all five.

DAILY · 3 MONTHS
Line chart: price change over 3 months of 4 of our ETFs with an extreme day on 30 October 2026; EWY −5.52% on the day, XLK −4.89% on the day, MTUM −4.77% on the day, EWT −4.60% on the day
DAILY · 1 YEAR
Candlestick chart: EWY price, daily, over 252 sessions to 30 Oct 2026, with its 20-day moving average; last 152.89, 6.7% below the average at 163.84
DAILY · 1 YEAR
Candlestick chart: XLK price, daily, over 252 sessions to 30 Oct 2026, with its 20-day moving average; last 179.51, 5.9% below the average at 190.86
DAILY · 1 YEAR
Candlestick chart: MTUM price, daily, over 252 sessions to 30 Oct 2026, with its 20-day moving average; last 284.10, 6.6% below the average at 304.21

Historical Returns After Extreme Days

Each date counts once. The return of our ETFs as a whole is the equal-weighted average of the returns of every ETF trading that day.

The Year After an Extreme Fall, by How Many of Our ETFs Had One

The dates run from 14 March 2011 to 29 September 2025, the last with a full year of returns after it. An episode is a run of dates no more than 21 sessions apart. Dates inside one episode often share much of the same following year, so a band's dates are not as many independent outcomes.

Share of our ETFs with an extreme fallDatesEpisodesMedian year afterp10 to p90Year positive on
No extreme fall3,708+10.6%−3.9% to +21.5%83%
Under 2%12031+11.1%−6.7% to +25.0%85%
2% to 10% (30 October 2026)15642+12.0%−6.3% to +26.5%74%
10% or more8023+14.7%−4.5% to +46.3%87%

After extreme rises, the same bands read +12.0%, +11.8% and +15.3% over the next year, against +10.6% after the dates with no extreme rise.

The ETFs With an Extreme Day

Each evening our 87 ETFs are sorted by how much their prices moved over the year before, and split into three groups of about the same size. On 30 October 2026, the least volatile third held 30 ETFs, the middle 29, the most volatile 28.

ETFSideReturn on the dayVolatility third
South Korea (EWY)Extreme fall−5.52%Most volatile third
Technology (XLK)Extreme fall−4.89%Most volatile third
Momentum Factor (MTUM)Extreme fall−4.77%Most volatile third
Taiwan (EWT)Extreme fall−4.60%Most volatile third
Gold (GLD)Extreme fall−3.47%Most volatile third

How Often Extreme Days Occur

DAILY · SINCE 2011
Bar chart: share of our ETFs with an extreme day, daily since 2011, to 30 October 2026; 6% with an extreme fall on the day

Our record begins on 14 March 2011. Identifying an extreme day requires ten years of price history for each ETF, and the share of our ETFs requires at least 20 of them with that history. Most of our ETFs launched in the 2000s, and that count was first reached on that date. The last three years:

DAILY · 3 YEARS
Bar chart: share of our ETFs with an extreme day, daily over the last 3 years, to 30 October 2026; 6% with an extreme fall on the day

Previous Episodes

On each side, an episode opens on a date when 10% or more of our ETFs had an extreme day of that side, after more than 21 sessions without one. Each row gives the episode's broadest day and that day's three largest moves. At 5.7%, 30 October 2026 is below the 10% at which an episode opens. The last episode of extreme falls opened on 5 June 2026.

First daySideBroadest dayLargest moves that day
30 July 2026Extreme rise30 July 2026, 10%EWY +11.79%, MTUM +5.53%, XLK +5.50%
11 June 2026Extreme rise11 June 2026, 16%EWY +11.48%, MTUM +4.62%, EWT +4.54%
5 June 2026Extreme fall5 June 2026, 22%EWY −14.11%, SLV −8.08%, EWT −7.25%
31 March 2026Extreme rise31 March 2026, 30%SLV +7.27%, EWY +5.65%, XLK +4.24%
3 March 2026Extreme fall20 March 2026, 19%EWY −6.71%, SLV −6.33%, CPER −4.06%
12 May 2025Extreme rise12 May 2025, 16%XLY +4.97%, XLK +4.64%, IWF +4.27%
9 April 2025Extreme rise9 April 2025, 83%XLK +13.43%, QQQ +12.00%, IWF +11.62%
3 April 2025Extreme fall4 April 2025, 78%XLE −9.20%, CPER −8.48%, XLF −7.32%
18 December 2024Extreme fall18 December 2024, 22%EWZ −6.67%, XLY −4.51%, IWM −4.43%
6 November 2024Extreme rise6 November 2024, 15%SLYV +6.11%, XLF +6.08%, IJR +5.99%
2 August 2024Extreme rise2 August 2024, 12%TLT +3.12%, IEF +1.55%, MBB +1.28%
10 April 2024Extreme fall10 April 2024, 19%VNQ −4.14%, EWY −3.83%, EMB −1.58%

Related


Romain Gandon
CEO, Quantlake

Disclaimer: This article is for informational and educational purposes only and does not constitute investment advice. Past performance is not indicative of future results.

More Research