Regime Market Trends: Defensives Take the Equity Lead
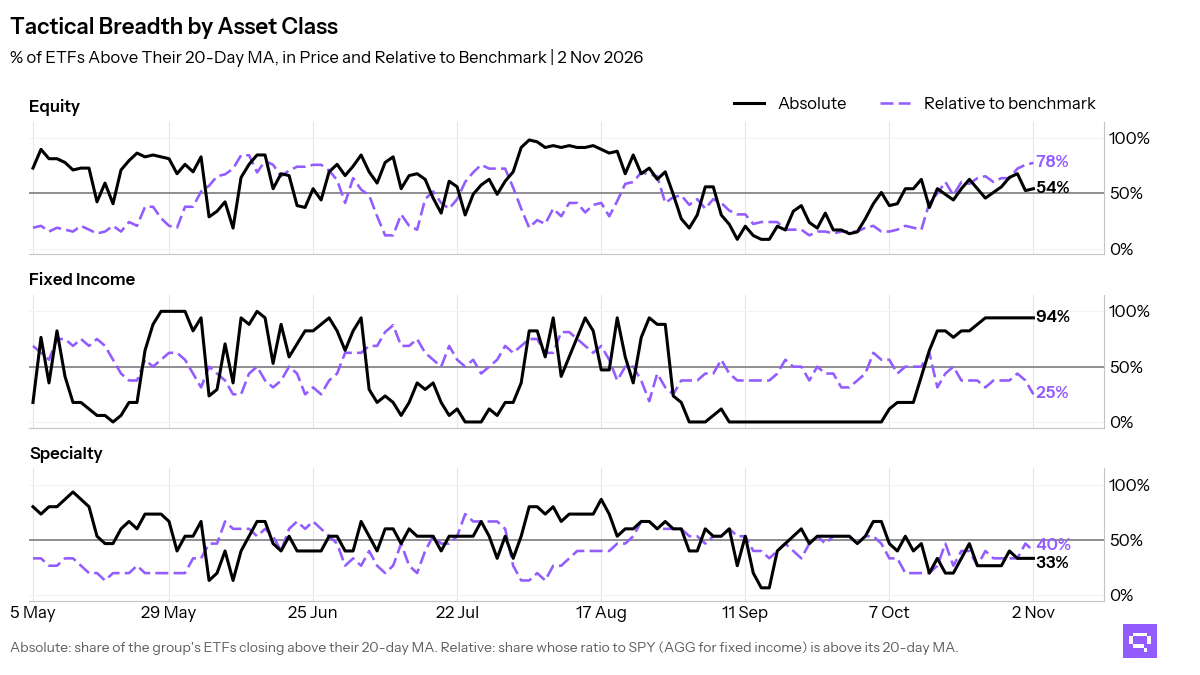
Equity relative breadth rose to 33%; the price-relative gap is 40pp
Dividend, value, and low-volatility leadership defined October at the October 30 close across our ETF universe. In equity, 43 of 59 ETFs (73%, -5.1pp) hold above their 10-month moving averages (10M MA), and 19 of 58 (33%, +15.5pp) outperform the S&P 500 SPY, a 40pp price-relative gap. Relative winners cluster in dividend, value, and low-volatility exposures. Emerging markets, China, and growth fill the laggard side.
Fixed income leadership is limited to mortgages, inflation-linked debt, intermediate Treasuries, and short duration vs the Aggregate Bonds AGG. Short duration accounts for 2 of 2 funds above their 10-month averages. Long duration is 0 of 1. High yield, investment grade, and preferreds lag the benchmark.
Specialty leadership is selective. Managed futures, biotech, bitcoin proxy, and min-volatility exposures outperform the S&P 500 SPY. Semiconductors and ether proxy lag the benchmark. Oil and broad commodities lead the commodity signals. Agriculture and silver trade below their 10-month averages.

Key Takeaways
South Korea EWY, up 57.26% over the trailing 10-month window, crossed below its 10M MA. South Korea EWY and Japan EWJ also crossed below their ratio MAs vs the S&P 500 SPY. Equity cross-timescale alignment is 53%, concentrated in low-volatility and dividend exposures.
Short Corporate VCSH and Short TIPS VTIP are the only bond ETFs above their 10-month averages. Short duration is 2 of 2 on price breadth, and long duration is 0 of 1. Mortgage-Backed MBB, intermediate Treasuries, and inflation-linked debt outperform the Aggregate Bonds AGG. High Yield HYG and Preferred Stock PFF lag the benchmark.
Min Volatility USMV crossed above its ratio MA vs the S&P 500 SPY. Semiconductors SMH and Ethereum Trust ETHA crossed below theirs, and both hold above their own 10-month averages in price. Oil and broad commodities align across price and relative strength. Agriculture and silver lag.
Featured ETF: iShares MSCI South Korea ETF EWY

Technical Signals
Equity: Price vs 10-month MA
| Signal | Ticker | Name | 10M perf |
|---|---|---|---|
| Cross-up | XLRE | The Real Estate Select Sector | +9.6% |
| Cross-up | MDYV | SPDR S&P 400 Mid Cap Value ETF | +11.9% |
| Cross-up | XLP | Consumer Staples Select Sector | +17.3% |
| Cross-up | SDY | SPDR S&P Dividend ETF | +17.7% |
| Cross-up | XLB | Materials Select Sector | +17.8% |
| Cross-down | EWY | iShares MSCI South Korea ETF | +57.3% |
| Cross-down | EEM | iShares MSCI Emerging Markets ETF | +12.2% |
| Cross-down | MDYG | SPDR S&P 400 Mid Cap Growth ETF | +11.8% |
| Cross-down | IMTM | iShares MSCI Intl Momentum Factor ETF | +7.4% |
| Cross-down | VWO | Vanguard FTSE Emerging Markets Index ETF | +3.6% |
| Cross-down | EWZ | iShares MSCI Brazil ETF | +3.1% |
| Cross-down | COPX | Global X Copper Miners ETF | +0.6% |
| Cross-down | IWF | iShares Russell 1000 Growth ETF | -0.3% |
Equity vs SPY: Price Ratio vs 10-month MA
| Signal | Ticker | Name | 10M rel perf |
|---|---|---|---|
| Cross-up | XLF | Financial Select Sector | -6.5% |
| Cross-up | ACWV | iShares MSCI Global Min Vol Factor ETF | -1.6% |
| Cross-up | QUAL | iShares MSCI USA Quality Factor ETF | +0.4% |
| Cross-up | VO | Vanguard Mid-Cap Index ETF | +1.6% |
| Cross-up | EFAV | iShares MSCI EAFE Min Vol Factor ETF | +1.8% |
| Cross-up | VIG | Vanguard Dividend Appreciation Index ETF | +2.2% |
| Cross-up | SPYV | S&P 500 Value ETF | +2.3% |
| Cross-up | RSP | Invesco S&P 500 Equal Weight ETF | +3.3% |
| Cross-up | VYM | Vanguard High Dividend Yield Index ETF | +4.0% |
| Cross-up | XLP | Consumer Staples Select Sector | +5.1% |
| Cross-up | SDY | SPDR S&P Dividend ETF | +5.4% |
| Cross-up | DVY | iShares Select Dividend ETF | +5.6% |
| Cross-up | SCHD | Schwab U.S. Dividend Equity ETF | +19.7% |
| Cross-down | EWY | iShares MSCI South Korea ETF | +40.8% |
| Cross-down | EWJ | iShares MSCI Japan ETF | +3.6% |
| Cross-down | QQQ | Invesco QQQ | +1.0% |
| Cross-down | SPYG | S&P 500 Growth ETF | -1.9% |
Fixed Income: Price vs 10-month MA
| Signal | Ticker | Name | 10M perf |
|---|---|---|---|
| Cross-up | VCSH | Vanguard Short-Term Corporate Bond Index ETF | +1.0% |
| Cross-up | VTIP | Vanguard Short-Term Inflation-Protected Securities Index ETF | +2.4% |
Fixed Income vs AGG: Price Ratio vs 10-month MA
| Signal | Ticker | Name | 10M rel perf |
|---|---|---|---|
| Cross-up | MBB | iShares MBS ETF | +0.4% |
| Cross-down | JNK | SPDR Bloomberg High Yield Bond ETF | +1.1% |
| Cross-down | HYG | iShares iBoxx $ High Yield Corporate Bond ETF | +0.9% |
| Cross-down | PFF | iShares Preferred and Income Securities ETF | -3.8% |
Specialty: Price vs 10-month MA
| Signal | Ticker | Name | 10M perf |
|---|---|---|---|
| Cross-up | VNQ | Vanguard Real Estate Index ETF | +9.2% |
| Cross-down | MTUM | iShares MSCI USA Momentum Factor ETF | +14.0% |
Specialty vs SPY: Price Ratio vs 10-month MA
| Signal | Ticker | Name | 10M rel perf |
|---|---|---|---|
| Cross-up | USMV | iShares MSCI USA Min Vol Factor ETF | -1.1% |
| Cross-down | SMH | VanEck Semiconductor ETF | +29.9% |
| Cross-down | MTUM | iShares MSCI USA Momentum Factor ETF | +2.0% |
| Cross-down | JEPQ | JPMorgan Nasdaq Equity Premium Income ETF | -3.0% |
| Cross-down | ETHA | iShares Ethereum Trust ETF | -32.9% |
Commodities: Price vs 10-month MA
| Signal | Ticker | Name | 10M perf |
|---|---|---|---|
| Cross-down | DBA | Invesco DB Agriculture | +5.4% |
Related
- Tactical Market Trends: Growth and Global Equity Lose the 20-Day
- Intermediate Market Trends: Value and Low-Vol Lead Equity Rotation
- SPY candlestick signals: forward returns by pattern and sentiment
- Fear and greed: today's market sentiment reading
- ETF trend metrics explained
Romain Gandon
CEO, Quantlake
Disclaimer: This article is for informational and educational purposes only and does not constitute investment advice. Past performance is not indicative of future results.