Tactical Market Trends: Low-Volatility Leads, Growth, Tech and Asia Lag
Equity relative breadth reaches 78%, 23pp above price participation.
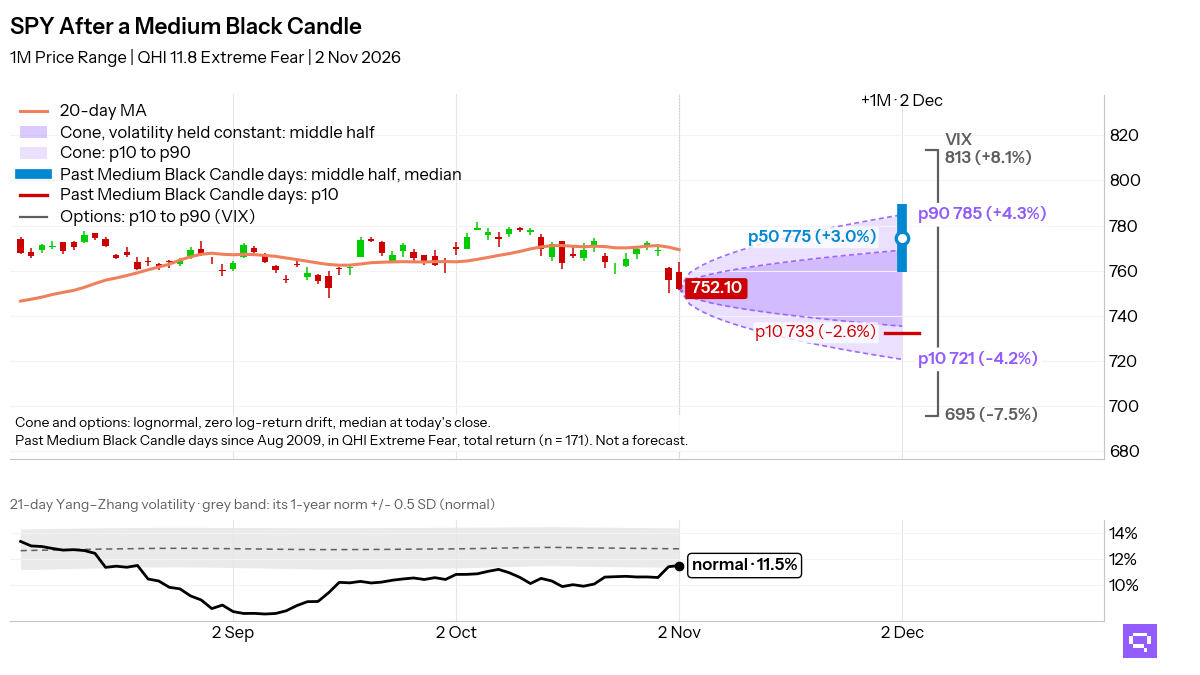
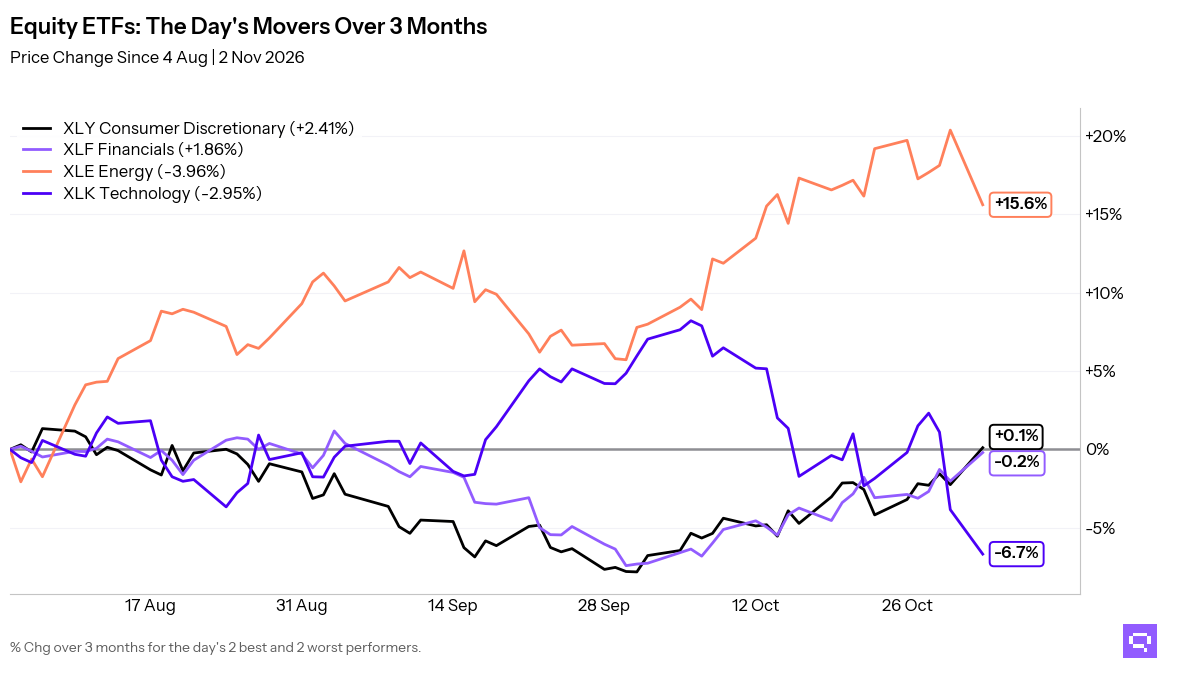
Low-volatility, dividend, and developed-market ETFs lead equities at the close on November 2. Across the ETF universe, 32 of 59 equity ETFs (54%, +1.7pp on the session) hold above their 20-day moving averages (20D MA), and 45 of 58 ETFs (78%, +1.7pp) outperform the S&P 500 SPY on a ratio basis, a -23pp price-relative gap. Low-volatility contributes 2 relative leaders and developed ex-US 4. US growth and technology account for 6 relative laggards, and Asia and emerging markets 6 more.
Fixed income leadership vs the Aggregate Bonds AGG is limited to long duration, mortgages, and munis. Price participation is broad, with 16 of 17 ETFs above their 20-day averages. Credit, EM debt, TIPS, and short duration are above their own averages and lag the benchmark. TIPS TIP and Int. Treasuries VGIT crossed below their ratio MAs.
Specialty leadership vs the S&P 500 SPY is limited to biotech, infrastructure, real estate, and minimum-volatility names. Gold, gold miners, momentum, and semiconductors fill the laggard cluster. Commodities weakened at the close as Oil USO and broad commodities crossed below their 20-day price MAs, and broad commodities also fell below their ratio MA vs the S&P 500 SPY.

Key Takeaways
Equity cross-timescale alignment is 58%. China MCHI, down 2.28% over the trailing 20-day window vs the S&P 500 SPY, crossed above its 20-day ratio MA vs SPY and moves into the cluster that trades below its price MA and above its ratio MA, alongside value, quality, and developed ex-US exposures.
Short-duration fixed income has 3 of 3 ETFs above price MAs, and long duration has 3 of 3. Relative winners vs the Aggregate Bonds AGG are 0 of 3 in short duration and 2 of 3 in long duration. Mortgages are the only bond theme aligned as a relative leader across daily, weekly, and monthly windows.
Oil USO, up 8.95% over the trailing 20-day window, crossed below its 20D MA. Broad Commodities PDBC crossed below both its 20D MA and its 20-day ratio MA vs the S&P 500 SPY. Managed Futures DBMF crossed below its ratio MA vs the S&P 500 SPY.
Featured ETF: United States Oil Fund LP USO

Technical Signals
Equity: Price vs 20-day MA
| Signal | Ticker | Name | 20D perf |
|---|---|---|---|
| Cross-up | EFA | iShares MSCI EAFE ETF | -0.32% |
| Cross-up | XLI | Industrial Select Sector | -0.23% |
| Cross-down | XLE | State Street Energy Select Sector SPDR ETF | +5.99% |
Equity vs SPY: Price Ratio vs 20-day MA
| Signal | Ticker | Name | 20D rel perf |
|---|---|---|---|
| Cross-up | MCHI | iShares MSCI China ETF | -2.28% |
Fixed Income vs AGG: Price Ratio vs 20-day MA
| Signal | Ticker | Name | 20D rel perf |
|---|---|---|---|
| Cross-down | TIP | iShares TIPS Bond ETF | unch. |
| Cross-down | VGIT | Vanguard Intermediate-Term Treasury Index ETF | -0.29% |
Specialty vs SPY: Price Ratio vs 20-day MA
| Signal | Ticker | Name | 20D rel perf |
|---|---|---|---|
| Cross-down | DBMF | iMGP DBi Managed Futures Strategy ETF | -0.52% |
Commodities: Price vs 20-day MA
| Signal | Ticker | Name | 20D perf |
|---|---|---|---|
| Cross-down | USO | United States Oil Fund LP | +8.95% |
| Cross-down | PDBC | Invesco Optimum Yield Diversified Commodity Strategy No K-1 ETF | +0.57% |
Commodities vs SPY: Price Ratio vs 20-day MA
| Signal | Ticker | Name | 20D rel perf |
|---|---|---|---|
| Cross-down | PDBC | Invesco Optimum Yield Diversified Commodity Strategy No K-1 ETF | +3.61% |
Related
- SPY candlestick signals: forward returns by pattern and sentiment
- Fear and greed: today's market sentiment reading
- ETF trend metrics explained
Romain Gandon
CEO, Quantlake
Disclaimer: This article is for informational and educational purposes only and does not constitute investment advice. Past performance is not indicative of future results.