Intermediate Market Trends: Value and Low-Vol Lead Equity Rotation
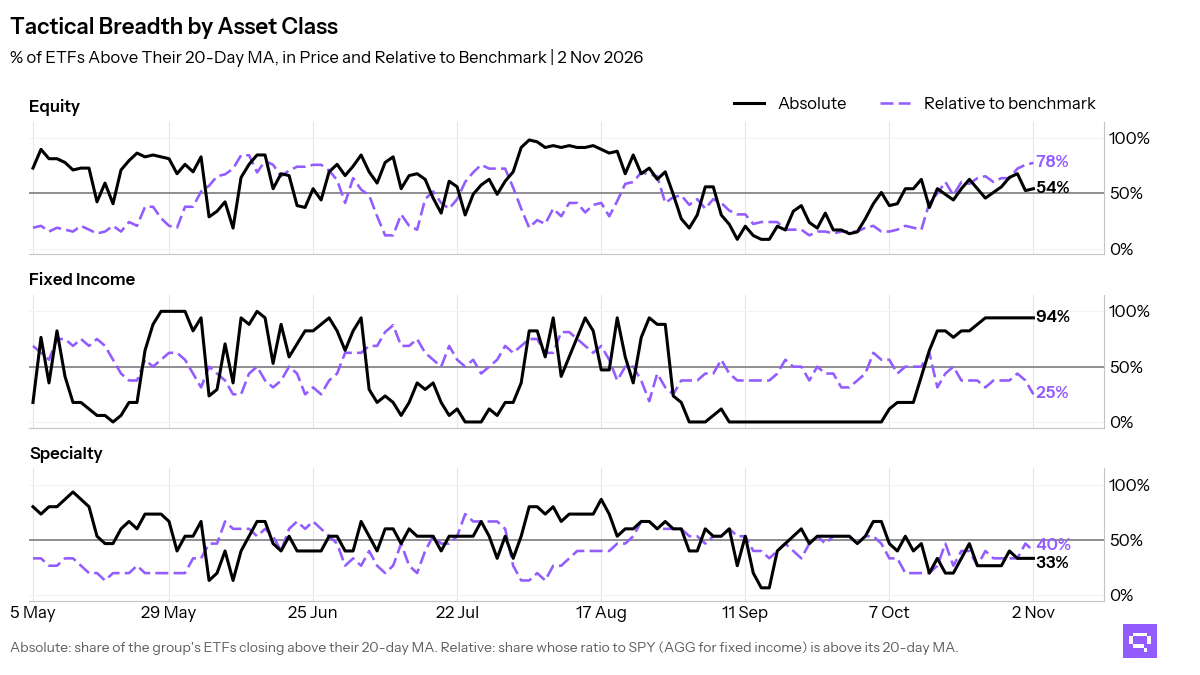
Relative equity breadth rose to 47%, ahead of 36% price participation
Defensive and value-oriented equity leadership defines the October 30 close. 21 of 59 ETFs (36%, +8.5pp on the week) sit above their 13-week moving average (13W MA), and 27 of 58 (47%, +12.1pp) sit above their ratio MA vs the S&P 500 SPY. Low-volatility led with two ETFs. Dividend and value-oriented US equity added five. Emerging markets and Asia-Pacific accounted for seven absolute laggards. United Kingdom EWU crossed above its 13-week average. Small-cap, India, and quality include names below their price averages but above benchmark on a relative basis. Relative leadership exceeds price participation by 11pp.
Fixed income leadership centers on Treasuries and mortgages. Short duration counts 2 of 2 above their price averages and 1 of 2 above the Aggregate Bonds AGG. Long duration counts 1 of 1 on both measures. Credit laggards cluster in high yield and EM debt.
Specialty leadership is limited to defensives and real estate. 6 of 15 ETFs sit above their ratio MA vs the S&P 500 SPY. REITs include names below their price averages but above benchmark on a relative basis. Crypto weakened as Bitcoin Trust IBIT and Ethereum Trust ETHA crossed below their price and ratio averages. Commodities strength centers on broad commodities and oil.

Key Takeaways
Bitcoin Trust IBIT crossed below its 13W MA and remains up 21.66% over the trailing 13-week window. Its ratio vs the S&P 500 SPY also crossed below its ratio MA. Ethereum Trust ETHA matched the same price and relative break.
Daily, weekly, and monthly equity alignment is 53%. The leadership cluster is concentrated in low-volatility, dividend, and quality exposures. Emerging markets EEM and South Korea EWY anchor the laggard side across those same horizons.
Investment Grade Credit LQD and Corporate Credit VCIT crossed above their 13-week averages. Both remain below their ratio MAs vs the Aggregate Bonds AGG. Mortgage-Backed MBB and 7-10yr Treasuries IEF improved on both price and relative measures.
Featured ETF: iShares Bitcoin IBIT

Technical Signals
Equity: Price vs 13-week MA
| Signal | Ticker | Name | 13W perf |
|---|---|---|---|
| Cross-up | XLRE | The Real Estate Select Sector | -3.4% |
| Cross-up | MDYV | SPDR S&P 400 Mid Cap Value ETF | -1.2% |
| Cross-up | EWU | iShares MSCI United Kingdom ETF | -1.2% |
| Cross-up | XLF | Financial Select Sector | -0.4% |
| Cross-up | XLY | Consumer Discretionary Select Sector | -0.4% |
| Cross-up | VO | Vanguard Mid-Cap Index ETF | +1.0% |
| Cross-down | EWZ | iShares MSCI Brazil ETF | -11.4% |
Equity vs SPY: Price Ratio vs 13-week MA
| Signal | Ticker | Name | 13W rel perf |
|---|---|---|---|
| Cross-up | INDA | iShares MSCI India ETF | -5.5% |
| Cross-up | XLRE | The Real Estate Select Sector | -4.8% |
| Cross-up | IJR | iShares Core S&P Small-Cap ETF | -4.6% |
| Cross-up | SLYV | SPDR S&P 600 Small Cap Value ETF | -3.2% |
| Cross-up | MDYV | SPDR S&P 400 Mid Cap Value ETF | -2.6% |
| Cross-up | XLF | Financial Select Sector | -1.8% |
| Cross-up | XLY | Consumer Discretionary Select Sector | -1.8% |
| Cross-up | IQLT | iShares MSCI Intl Quality Factor ETF | -0.9% |
| Cross-down | EWZ | iShares MSCI Brazil ETF | -12.7% |
Fixed Income: Price vs 13-week MA
| Signal | Ticker | Name | 13W perf |
|---|---|---|---|
| Cross-up | VCIT | Vanguard Intermediate-Term Corporate Bond Index ETF | -0.7% |
| Cross-up | LQD | iShares iBoxx $ Investment Grade Corporate Bond ETF | -0.6% |
| Cross-up | IEF | iShares 7-10 Year Treasury Bond ETF | -0.2% |
| Cross-up | MBB | iShares MBS ETF | +0.2% |
Fixed Income vs AGG: Price Ratio vs 13-week MA
| Signal | Ticker | Name | 13W rel perf |
|---|---|---|---|
| Cross-up | IEF | iShares 7-10 Year Treasury Bond ETF | -0.2% |
| Cross-up | IEI | iShares 3-7 Year Treasury Bond ETF | unch. |
| Cross-up | VGIT | Vanguard Intermediate-Term Treasury Index ETF | unch. |
| Cross-up | MBB | iShares MBS ETF | +0.2% |
Specialty: Price vs 13-week MA
| Signal | Ticker | Name | 13W perf |
|---|---|---|---|
| Cross-up | VNQ | Vanguard Real Estate Index ETF | -4.2% |
| Cross-down | IBIT | iShares Bitcoin | +21.7% |
| Cross-down | ETHA | iShares Ethereum Trust ETF | +19.5% |
| Cross-down | FTLS | First Trust Long/Short Equity ETF | +2.1% |
Specialty vs SPY: Price Ratio vs 13-week MA
| Signal | Ticker | Name | 13W rel perf |
|---|---|---|---|
| Cross-up | REET | iShares Global REIT ETF | -7.4% |
| Cross-up | VNQ | Vanguard Real Estate Index ETF | -5.6% |
| Cross-down | IBIT | iShares Bitcoin | +20.0% |
| Cross-down | ETHA | iShares Ethereum Trust ETF | +17.8% |
Related
- Tactical Market Trends: Growth and Global Equity Lose the 20-Day
- SPY candlestick signals: forward returns by pattern and sentiment
- Fear and greed: today's market sentiment reading
- ETF trend metrics explained
Romain Gandon
CEO, Quantlake
Disclaimer: This article is for informational and educational purposes only and does not constitute investment advice. Past performance is not indicative of future results.