.png)

What If You Invested $1,000 a Month in an ETF Portfolio?
Three classic portfolio models tracked by Quantlake, Bogle-, Swensen- and Buffett-Inspired, backtested with a fixed amount bought every month. From January 2010, Bogle-Inspired returned 13.05% a year on the money paid in and Swensen-Inspired 9.25%; Buffett-Inspired, backtested from January 2003, returned 12.12% a year through the 2008-09 crash and the years since.
Quantlake DCA Study · data through 31 August 2026 · updated 18 September 2026 · refreshed monthly
Dollar-cost averaging means investing equal amounts at regular intervals, whatever the market is doing; our study of monthly investing sets out the definition and what it does over 90 ETFs and 28 funds.
The example is a $1,000 monthly contribution, split by each model's target weights, bought on the first trading day of every month and reported after the last trading day of each month. Each plan runs four ways: the payment flat or raised each January with inflation, and the holdings left alone or rebalanced each January. Every figure is also given against the money paid in carried forward by consumer prices.
What $1,000 a month became
Those are the plans left alone, with a flat payment; three other versions of each are further down. What follows is what happened on the way there. Run the same arithmetic on another amount, or read the models themselves at Quantlake model portfolios.
What this study shows
- A crash reaches a monthly plan in part. In 2008-09 Buffett-Inspired's portfolio fell 50.1% while the statement fell 37.7%, because the payments made during the crash bought at lower prices and the money still to come was not yet invested.
- Five years was not always enough. 8% of five-year Buffett-Inspired plans ended below the money paid in, the worst at −16.7% a year.
- Left alone, a plan drifts. Bogle-Inspired's 80%/20% split between shares and Treasuries became 94%/6%; rebalancing each January held the allocation and ended 11.0% lower in this window.
- A fund and its buyer can part. VGLT returned 2.60% a year while the monthly buyer's money-weighted return was −0.22%.
What this page covers
- What happened in each crash
- Whether five years was always enough
- What rebalancing changed
- How VGLT gained while its buyer lost
- What is left after inflation
- How each plan is run, and what it costs
- What the backtest can and cannot say
This month
In August 2026, before the new money, Buffett-Inspired returned +2.6%, Bogle-Inspired +2.6% and Swensen-Inspired +1.5%, never rebalanced. SPY returned +2.7%, dividends included; among the nine ETFs, VEA did best at +3.3% and VNQ worst at −2.5%. Each plan received its $1,000 on 3 August 2026. No rebalancing this month; the rebalanced versions next trade back to their targets on 4 January 2027.
The three portfolios
Bogle-Inspired
| ETF | What it holds | Target weight | Of each $1,000 |
|---|---|---|---|
| SPY | S&P 500 | 60% | $600 |
| VTI | US Broad Market | 20% | $200 |
| VGLT | Long Treasury | 20% | $200 |
SPY tracks the S&P 500. VTI covers the whole US stock market, adding the mid-size and small companies outside the S&P 500. VGLT invests in long-term US Treasuries. Together: 80% US shares and 20% long-term Treasuries.
Swensen-Inspired
| ETF | What it holds | Target weight | Of each $1,000 |
|---|---|---|---|
| VTI | US Broad Market | 30% | $300 |
| VEA | Developed Markets | 15% | $150 |
| VWO | Emerging Markets | 5% | $50 |
| VGIT | Intermediate Treasuries | 15% | $150 |
| TIP | TIPS | 15% | $150 |
| VNQ | Real Estate | 20% | $200 |
Together: 50% US and international shares, 30% Treasuries (15% intermediate-term, 15% inflation-protected) and 20% real estate.
Buffett-Inspired
| ETF | What it holds | Target weight | Of each $1,000 |
|---|---|---|---|
| SPY | S&P 500 | 90% | $900 |
| SHY | Short Treasuries | 10% | $100 |
In his letter to Berkshire Hathaway shareholders of 28 February 2014, Warren Buffett described the instruction he had left for a trust for his wife: 10% in short-term government bonds and 90% in a very low-cost S&P 500 index fund (2013 annual letter, page 19). Buffett-Inspired holds that mix through SPY and SHY, a fund of 1- to 3-year Treasuries. SHY began trading in July 2002, so this plan starts in January 2003, seven years before the other two, and its record includes the 2008-09 crash.
Bogle-Inspired, Swensen-Inspired and Buffett-Inspired are Quantlake model names for allocations in the style of John Bogle, who founded Vanguard, David Swensen, who managed Yale University's endowment, and Warren Buffett. No model is affiliated with or endorsed by Vanguard, the John C. Bogle Center for Financial Literacy, Yale University or Berkshire Hathaway.
Whether monthly investing protects a plan in a decline, and for how long, is the question the Quantlake DCA Study answers: Does Dollar-Cost Averaging Work?
How each plan is run
The figures below are a backtest: computed from historical prices, with no real account behind them.
- Purchases. $1,000 a month per plan, on the first trading day of the month, bought at the open and split by the target weights.
- Fractional shares. The plans buy fractions of a share, so each payment is split exactly by the weights. A buyer whose broker sells whole shares only has to check, ETF by ETF, that each month's amount covers at least one share: at the 31 August 2026 close, Swensen-Inspired's $50 for VWO was less than one share at $60.52, and Bogle-Inspired's $600 for SPY less than one at $767.05. The more ETFs a plan holds, the smaller each monthly amount: Swensen-Inspired splits each payment six ways, Buffett-Inspired two.
- Four versions of each plan. Flat payments of $1,000, or payments raised each January by past inflation, and each of them either never rebalanced or rebalanced each January.
- Raised with inflation. Each January the payment rises by the latest 12-month change in US consumer prices published by that day, so it keeps its purchasing power: $1,000 a month in 2010 became $1,496 by August 2026, and $1,000 in 2003 became $1,786.
- Never rebalanced: each month's money is split by the targets whatever the holdings weigh, so the weights drift with the markets. Rebalanced each January: at the January purchase, the holdings and the new money together are brought back to the targets.
- Taxes. Not modelled. Taxes on dividends, on the January rebalancing sales and on the final sale are left out of every figure; depending on the account and the country they can change the final outcome, and a rebalanced plan sells more often than one left alone.
- Costs. A 1 basis point spread on every purchase and sale, 10 cents on a $1,000 payment, and the ETFs' own fees, which are already inside their prices. Nothing else is charged: no broker commission, ticket minimum, platform or custody fee, currency conversion or advisory fee. Those fall on the same payments and compound away with them. A flat $1 commission per ETF per purchase, for instance, would have taken $600 from Bogle-Inspired over its 200 payments and $1,200 from Swensen-Inspired, which buys six ETFs a month, before counting the growth that money would have had. The calculator prices a yearly fee over a chosen horizon.
Every version, side by side
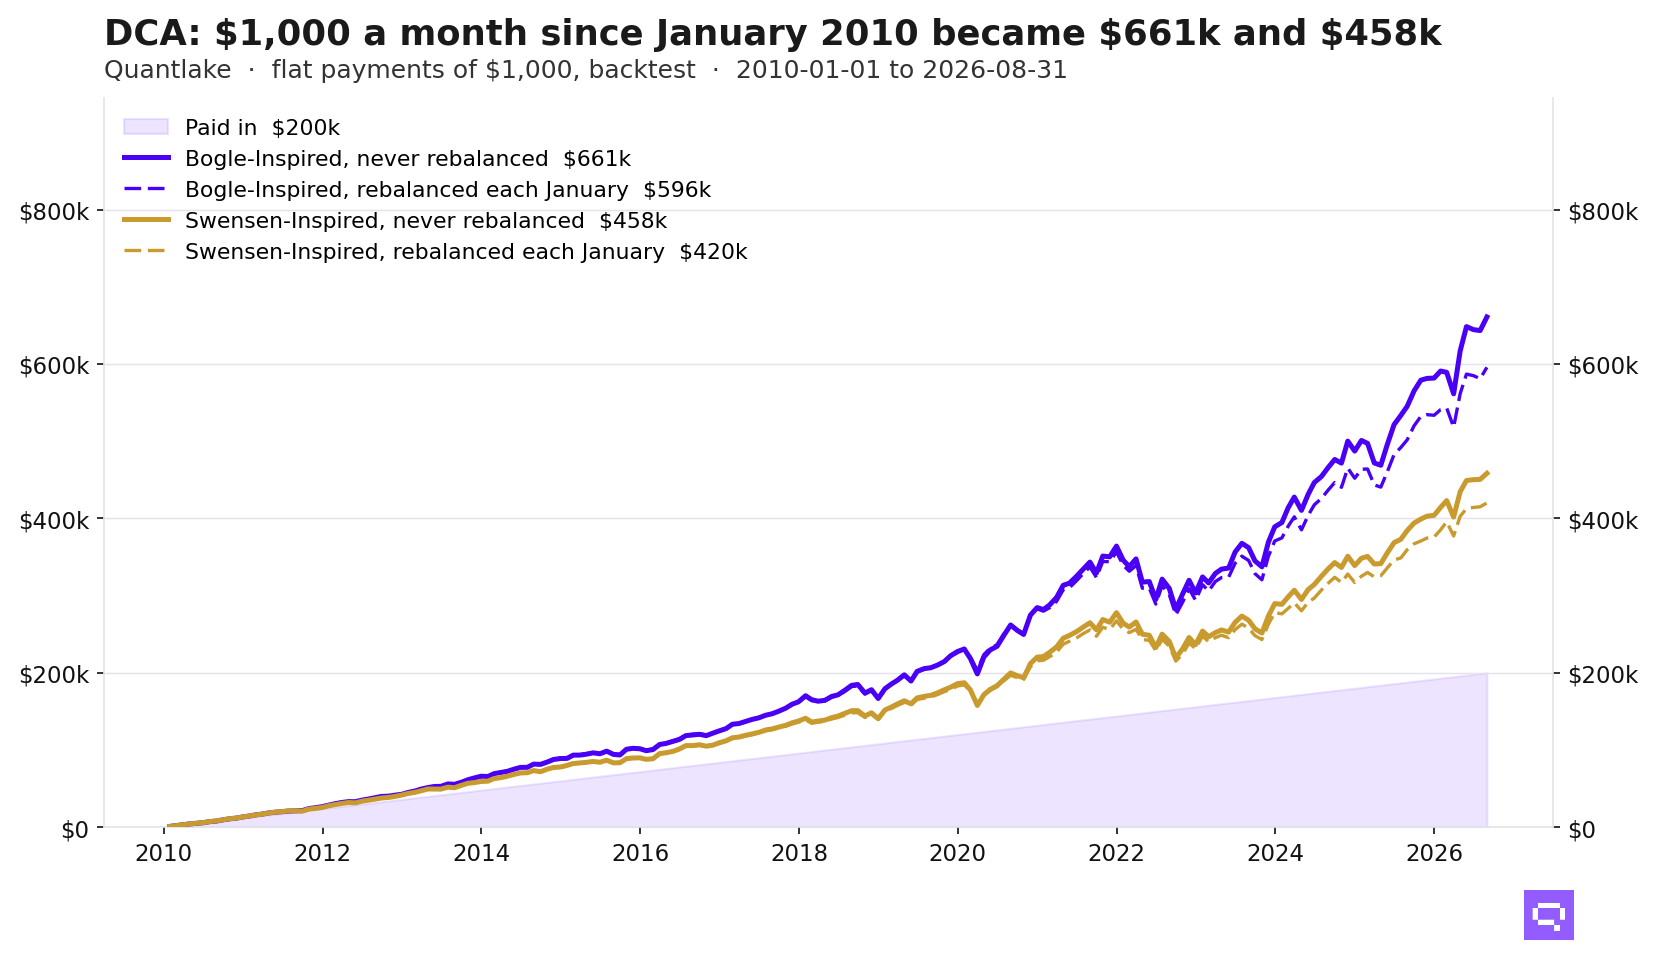
In the backtest from January 2010 to 31 August 2026, the flat plans paid in 200 payments of $1,000, $200,000 in all; raised with inflation, the same 200 payments came to $236,601. Buffett-Inspired is shown over the same months for comparison.
Time-weighted return, the portfolio's own and the figure a fund reports, flat and never rebalanced: Bogle-Inspired 12.74% a year and Swensen-Inspired 9.10% from January 2010; Buffett-Inspired 13.34% over the same months and 10.89% from January 2003.
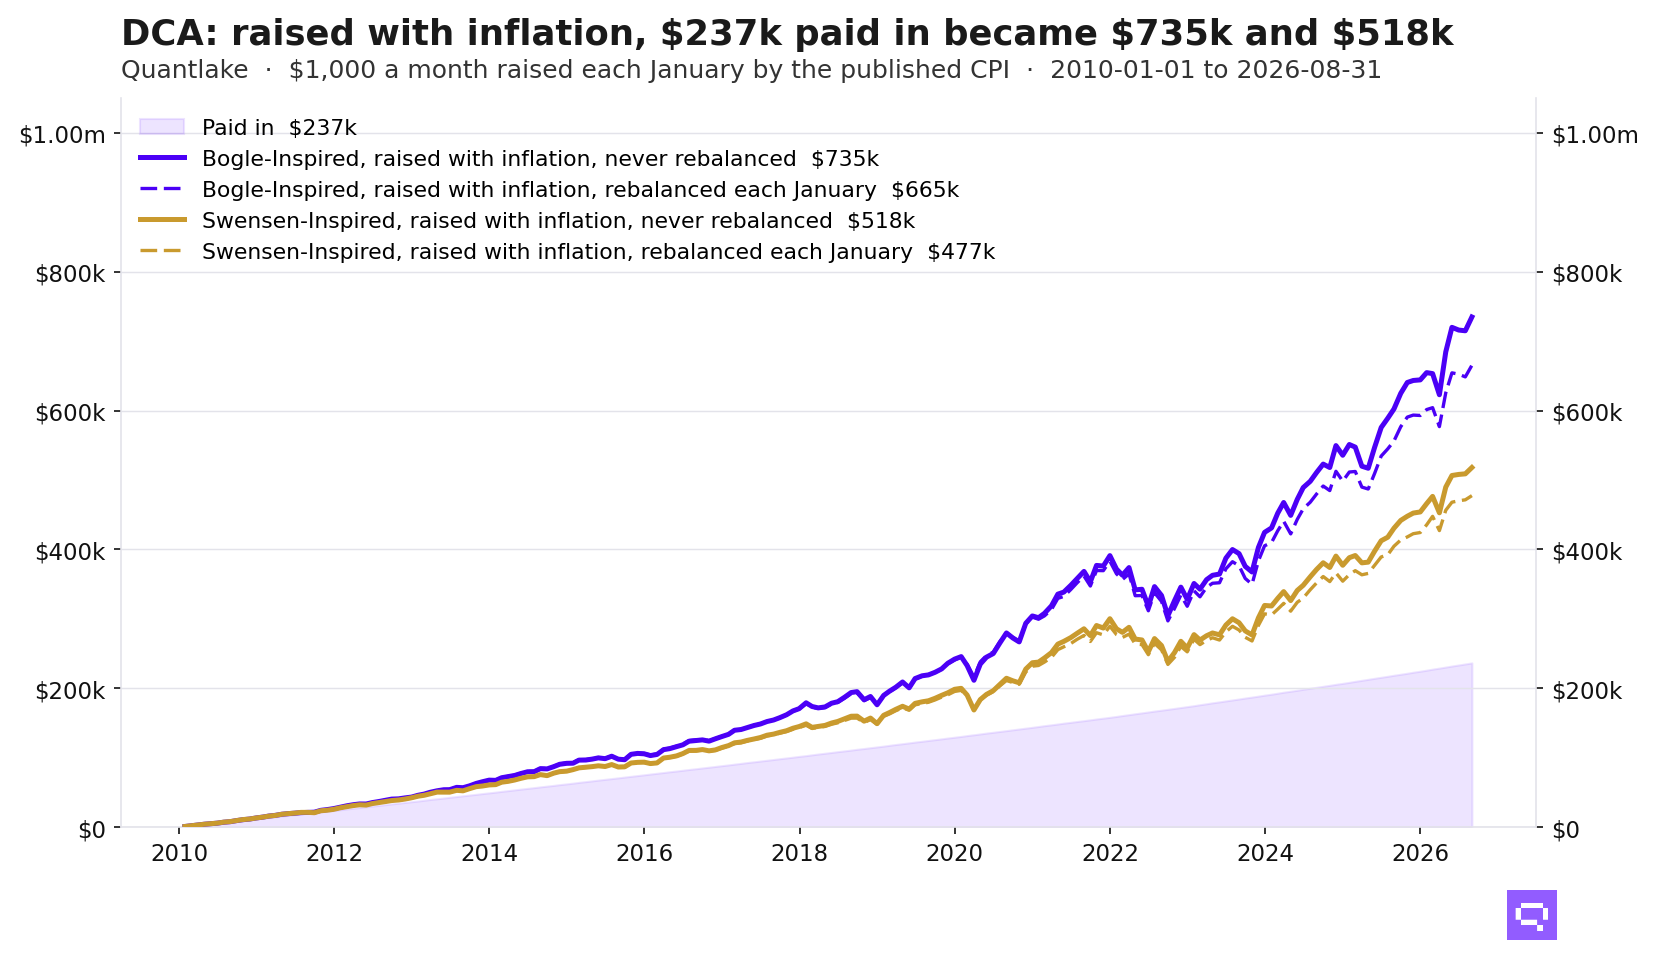
Buffett-Inspired, from January 2003, made 284 payments: $284,000 flat, or $373,580 raised with inflation.
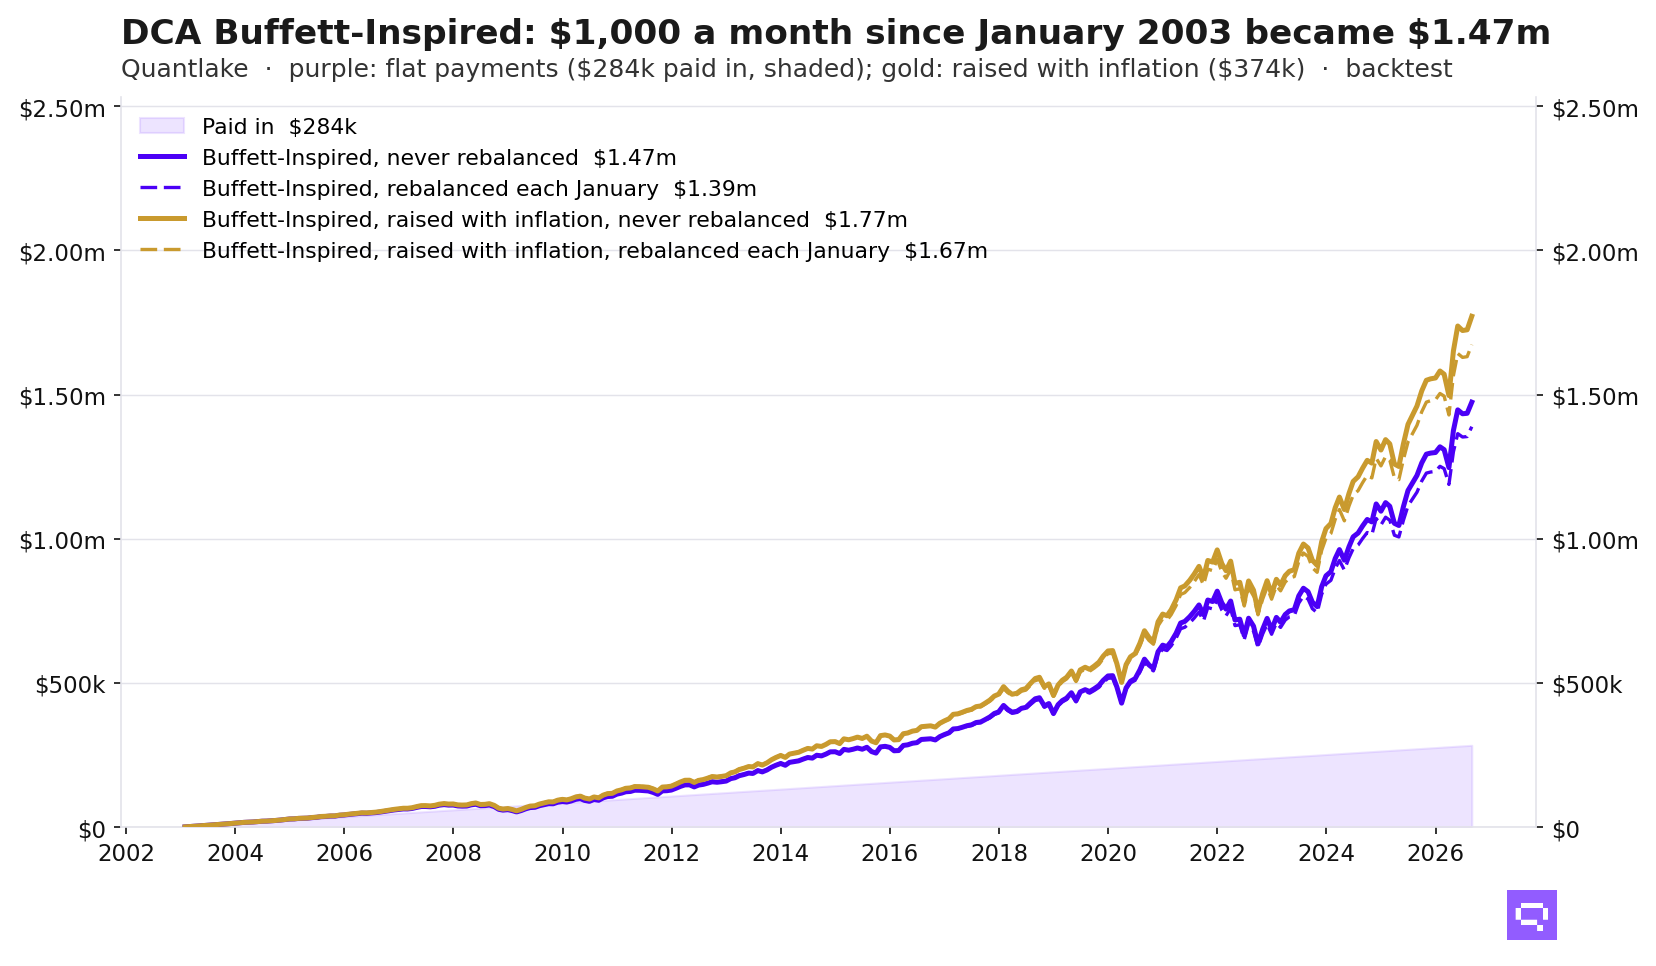
The money-weighted return (MWR) is the annual rate that turns each payment, counted from its own date, into the final value: the return on the investor's money. The time-weighted return (TWR) takes the payments out and measures the portfolio itself, the figure a fund reports. In short, the MWR is what your money earned and the TWR what the portfolio earned. Over the same months from January 2010, Buffett-Inspired ended at $729,329, Bogle-Inspired at $661,045 and Swensen-Inspired at $458,463; SPY returned 14.21% a year, VEA 7.62%, VNQ 8.79% and VGIT 2.19%. Raising the payment with inflation put more money in and barely moved the return on it: +13.07% a year against +13.05% for Bogle-Inspired.
Did the plans ever fall below the money paid in?
Buffett-Inspired stayed below it longest. From January 2003, it spent 4.9% of its days below the money paid in, the last on 6 July 2010, 7.5 years in. The plan was 4.8 years old when its index fell 50.1% from 9 October 2007 to 9 March 2009; the statement fell 37.7%.
Bogle-Inspired spent 1.5% of its days below the money paid in, the last on 10 August 2011, and Swensen-Inspired 1.6%, the last on 7 October 2011. Their path started 10 months after SPY's low of 9 March 2009, and neither went below again, through the falls of 2020 and 2022.
One path is one start date. So each plan was run again from every start month that leaves five years of history: 224 for Buffett-Inspired, 140 for the other two. "Median" in the rest of this article is taken across those start months. 8% of the five-year Buffett-Inspired plans ended below the money paid in: the 19 started between October 2003 and September 2005, which ended between October 2008 and September 2010. Its worst start, March 2004, returned −16.7% a year. No five-year Bogle-Inspired plan ended below the money paid in. For Swensen-Inspired, 1% did.
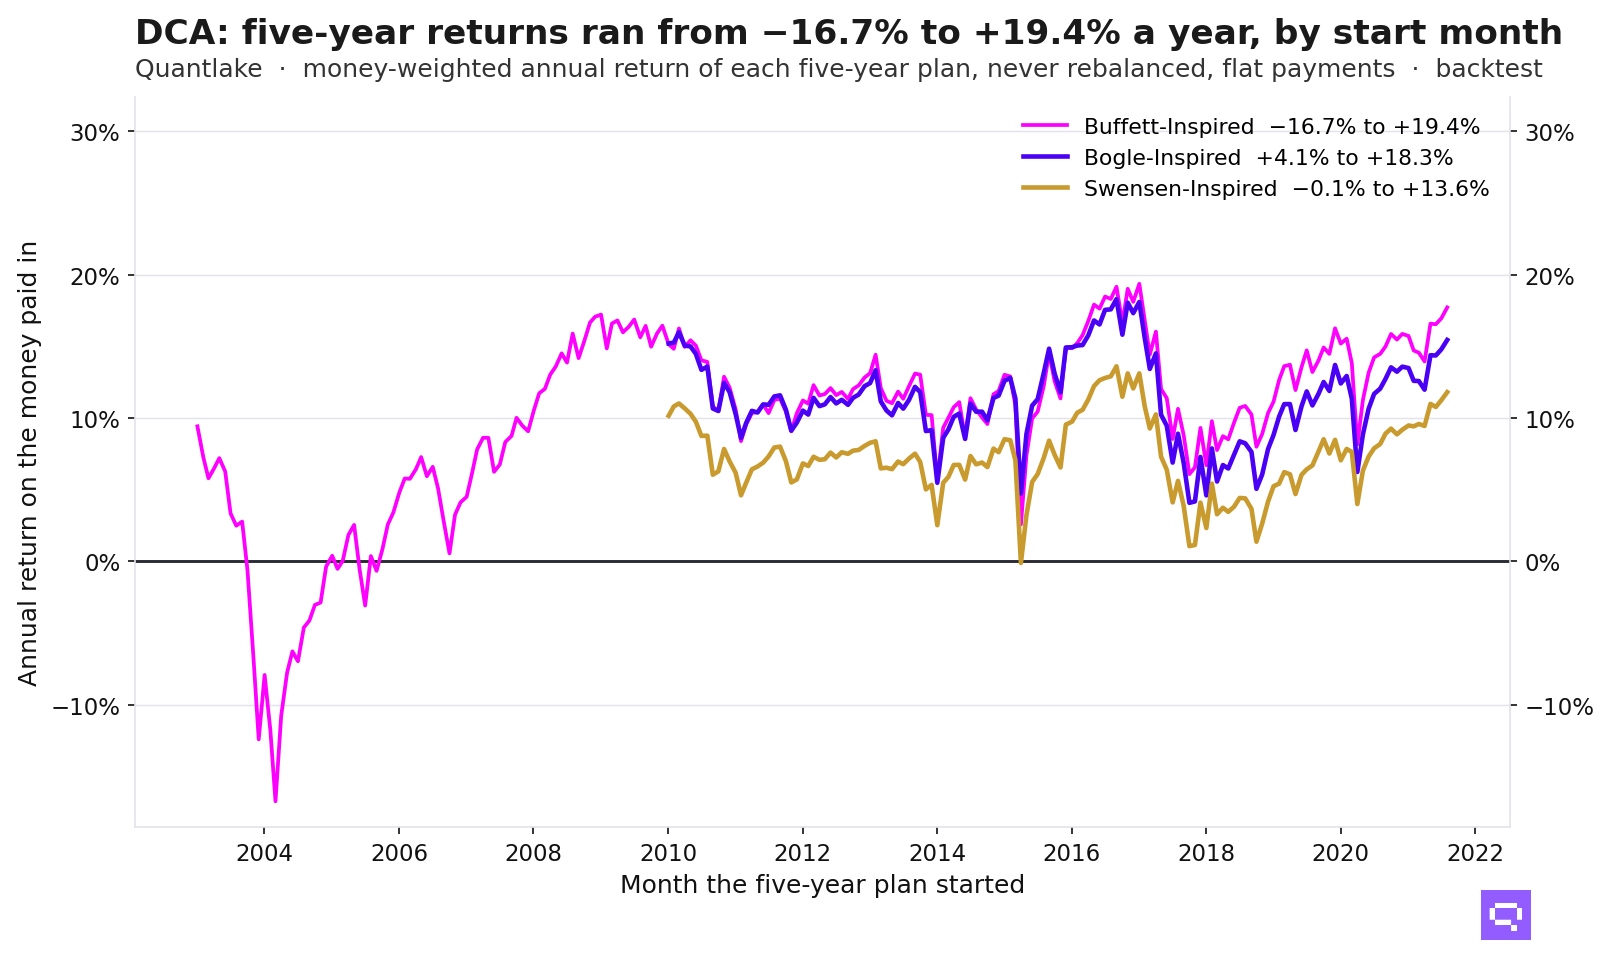
Buffett-Inspired's only five-year plans below zero are those 19, each with the 2008 crash inside its five years; Bogle- and Swensen-Inspired start after it, and their deepest fall was 28.2%, in 2020. Swensen-Inspired's worst start, April 2015, returned −0.1% a year, its five years ending on 1 April 2020, 9 days after the 2020 low. Across the wider Quantlake ETF Universe, more than half of ten-year monthly plans still dipped below the money paid in at some point after their fifth year (What a Market Crash Does to a Monthly Investment Plan).
What is left after inflation
Carry each payment forward by consumer prices, and the $200,000 paid into Bogle- and Swensen-Inspired is worth $259,925 in August 2026 money; the $284,000 paid into Buffett-Inspired, $400,033. Against that, Bogle-Inspired is 154.3% ahead, Swensen-Inspired 76.4% and Buffett-Inspired 268.4%. Buffett-Inspired spent 9.0% of its days below it, Bogle-Inspired 1.8% and Swensen-Inspired 2.1%; the last day below came in October 2011 for Bogle-Inspired and November 2011 for Swensen-Inspired and Buffett-Inspired. Across five-year start months, 12% of Buffett-Inspired plans ended below the inflation-adjusted money paid in, 12% of Swensen-Inspired and 2% of Bogle-Inspired.
What each fall cost, in months of payments
Each fall of 10% or more in each plan, flat payments, never rebalanced. The portfolio's fall leaves out the new money; the statement's includes the payments made during the fall, which is why it is smaller. The market's loss is counted in months of payments, and the recovery in months from the low until the statement regained its pre-fall value.
The 2008-09 fall took $40,517 from Buffett-Inspired, 41 months of payments, when the plan was 4.8 years old; the statement regained its pre-fall value 6.2 months after the low, new payments included. A smaller fall in 2020, 32%, took 178 months of payments, because by then the plan was 17 years old.
When the market started to outweigh the payments
In November 2004, 1.9 years in, the market moved Buffett-Inspired by more than the month's $1,000 for the first time; Bogle-Inspired crossed the same line in October 2011. In the median month of the last twelve, the market moved Buffett-Inspired by $24,091, about 24 times the payment, and Bogle-Inspired by $10,484. 81% of Buffett-Inspired's value is now market gain and 19% money paid in.
What does rebalancing change?
Rebalancing keeps a portfolio at the allocation it was built with. Left alone, the weights followed the markets: SPY grew from 90% to 97.6% of Buffett-Inspired and from 60% to 71.2% of Bogle-Inspired, where VGLT fell from 20% to 5.9%; in Swensen-Inspired, VTI grew from 30% to 49.4%.
The risk profile drifted with the weights. Bogle-Inspired was built as 80% shares and 20% Treasuries; left alone, its weight in shares passed 90% in October 2022 and stood at 94.1% in August 2026, against 82.2% rebalanced each January. Swensen-Inspired's weight in US and international shares went from 50% to 68.7% left alone. A plan left alone for years carries a different risk from the one it was built with.
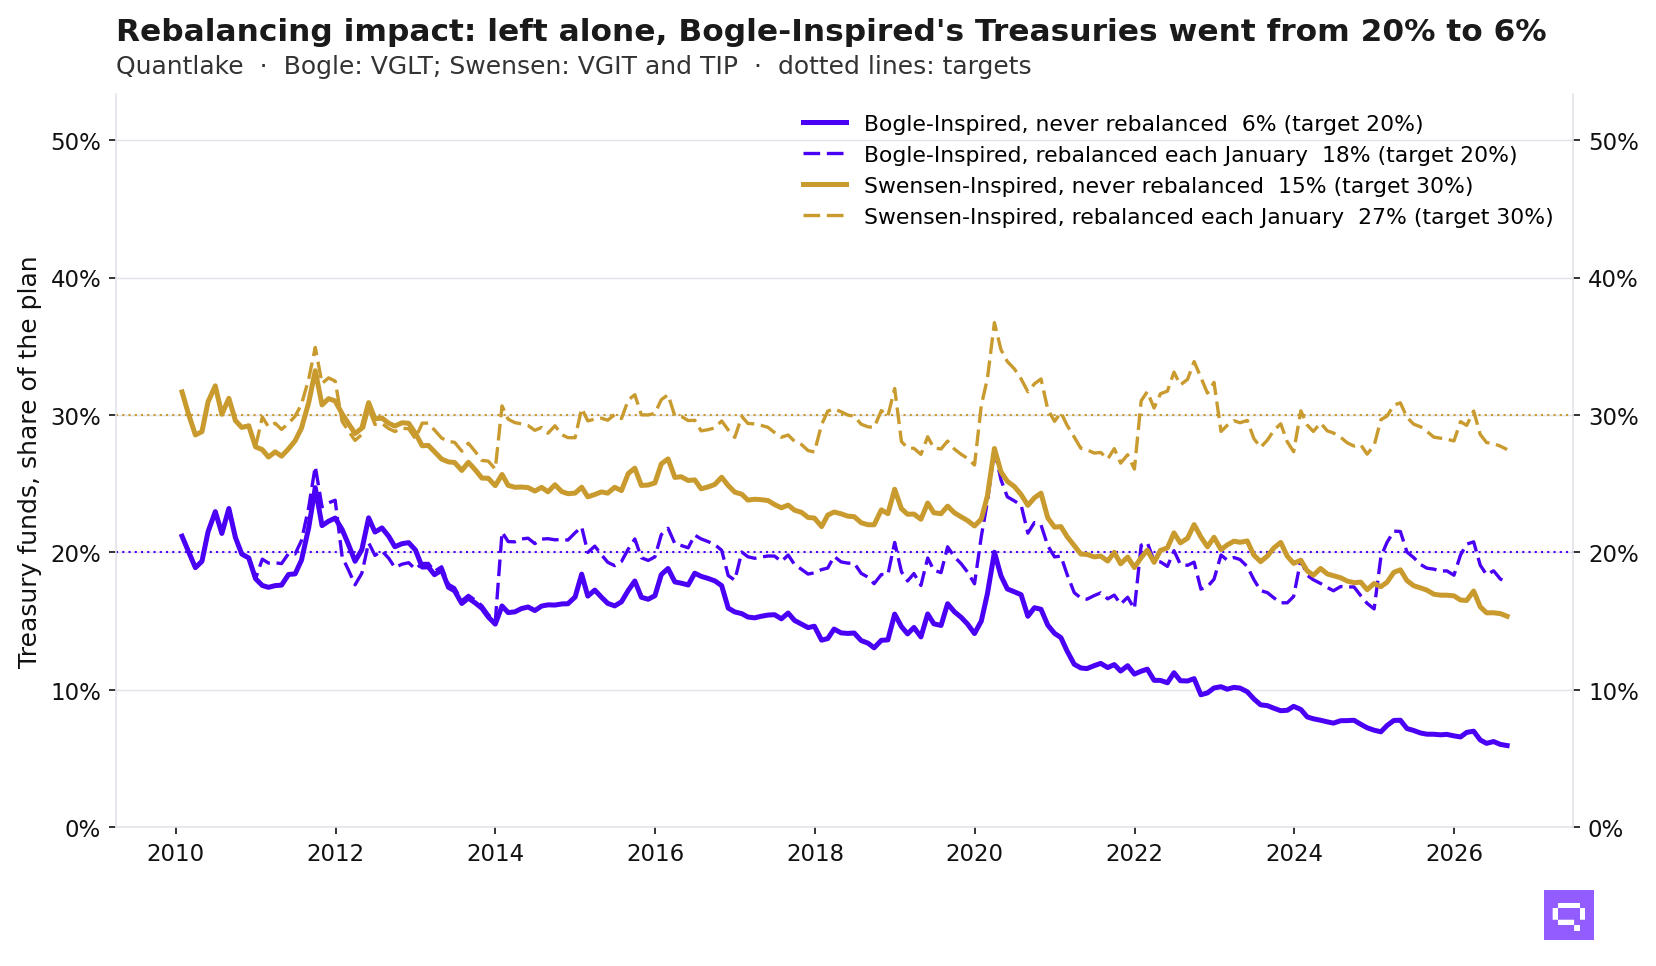
Holding the allocation had a price in this period, because shares beat Treasuries by a wide margin. Rebalancing each January sold what had risen, mostly SPY and VTI, which returned 14.2% and 14.0% a year, and bought what had lagged, VGLT at 2.6% a year in Bogle-Inspired. The gap in final value was widest for Bogle-Inspired, whose version left alone ended 11.0% higher, against 9.1% for Swensen-Inspired and 6.1% for Buffett-Inspired over its longer period. In exchange, rebalancing made the 2020 fall 1.9 to 3.1 points shallower across the three plans. In 2022 it made Bogle-Inspired's fall slightly deeper, 25.8% against 25.3%, because the rebalanced plan then held more Treasuries: 15.9% in VGLT at the end of 2021 against 11.1% left alone.
The gap is this window's spread between shares and Treasuries, so it moves with the start date and with the length of the plan. Started in other months, the five-year gaps stayed within 2.4 points either way and the ten-year within 6.1. A negative gap is a window where the rebalanced plan ended ahead, because what each January sold went on to lag what it bought:
Rebalancing did the job it exists for, keeping each plan at its intended allocation; the gap in final value measures what shares' lead over Treasuries was worth over the start dates and lengths this history allows.
How an ETF can gain while its buyer loses: VGLT
One holding in the three plans is worth less than the money put into it. VGLT (Long Treasury) is 20% of Bogle-Inspired: $40,000 went in and it was worth $39,265 on 31 August 2026. The fund's own return, time-weighted, was 2.60% a year over the period, while the monthly buyer's money-weighted return was −0.22% a year, because of when the money arrived: 128 of the 200 payments were in by the fund's high on 4 August 2020, when the 20-year Treasury yield stood at 0.96%, and by its low on 19 October 2023 the yield was 5.30% and the price 46.2% lower.
Backtest scope and caveats
- Start dates. Bogle- and Swensen-Inspired start in January 2010, the first calendar year all their ETFs trade (VGLT from November 2009); Buffett-Inspired in January 2003 (SHY from July 2002). Values across the two windows are not comparable; the same-months rows are.
- Start-date dependence. One start date is one path; the every-start-month figures overlap heavily: 3.3 independent five-year plans from January 2010 and 4.7 from January 2003.
- Inflation. US consumer prices (CPI-U, seasonally adjusted). The payment raises use the figure published on each January purchase day; the after-inflation figures use the latest revision.
Updated after the last trading day of each month. The plans carry on unchanged; any rule change is announced in advance and logged here with its date.
Frequently asked questions
Related
- Quantlake model portfolios: Classic and Smart
- Does dollar-cost averaging work? A study on ETFs and funds
- What a market crash does to a monthly investment plan
- Portfolio drift: how far a 60/40 moves on its own
- Lump sum vs dollar-cost averaging: a study on ETFs and funds
- Quantlake studies: the ETFs and funds tested, and the method
- Compound interest calculator with volatility, inflation and fees