.png)

Quantlake Studies: The ETFs and Funds Tested
Every Quantlake DCA study runs on one published list: 90 US-listed ETFs priced from 1993 or their launch, and 28 US mutual funds priced from 1979. This page holds the simulation rules, the selection rules, the limits and every fund.
Methodology version 1.0 · data through 31 August 2026 · fund net assets on 17 September 2026 · updated 18 September 2026
If a figure in a Quantlake study looks too good or too bad, this page is where to check it: every fund the studies use, the rules that chose them, and how prices become the figures quoted.
The Quantlake DCA Study runs every test on one published list of funds, so that a figure in one article can be checked against the others and against the prices. Each article names the part of the list it uses. When a fund joins or leaves, this page says so and its date changes.
How often this is refreshed. The study is refreshed once a month, after the month's last trading day: the prices extend by one month, the figures are updated from them, and the date at the top of each page moves. The method, the rules and the list of funds stay as described here. The fund net assets quoted here move with it. They describe what the list covers and are never used as a weight, so a month of staleness in them would not change a result.
Methodology at a glance
| Funds tested | 90 US-listed ETFs and 28 US mutual funds |
| Money in them | $5.3 trillion and $2.9 trillion on 17 September 2026 |
| Prices from | 1993 for the ETFs, 1979 for the funds, to 31 August 2026 |
| The plan | $1,000 on the first trading day of each month, one plan per starting month |
| Prices used | Adjusted for splits and dividends, so dividends are reinvested; fund fees are already inside them |
| Trading cost | 1 basis point on every purchase and sale |
| Waiting money | The 3-month Treasury bill rate, less 10 basis points a year |
| How figures are pooled | Each fund is summarised first and counts once, whatever its size or history |
| Crashes | 15 market-wide episodes, separate from the 621 individual fund falls |
| Not modelled | Taxes, commissions and platform fees; closed funds are absent and uncorrected |
What this page covers
- How a monthly plan is simulated, priced and costed
- How a crash is defined, and how many separate crashes the record holds
- What "typical" means in every figure we publish
- How our ETF universe and our mutual fund universe were built and cut
- What the data is, and what the method does not claim
- The full list of every fund, at the end
How a plan is simulated
Dollar-cost averaging means investing equal amounts at regular intervals, whatever the market is doing. FINRA, the US broker regulator, describes it as investing "in equal portions, at regular intervals, regardless of current market conditions" (FINRA); the academic literature uses the same definition, periodic purchases of equal dollar amounts (Constantinides, 1979, Journal of Financial and Quantitative Analysis).
We apply that rule the same way in every fund.
- A plan. $1,000 invested in one fund on the first trading day of every month, from a given starting month, for a fixed number of years. There is one plan per starting month in each fund; only the model portfolios spread each payment across several funds.
- Purchases. ETFs are bought at the day's opening price. Mutual funds price once a day, after the close, so they are bought at that day's net asset value.
- Prices. End-of-day prices adjusted for splits and dividends, so dividends are reinvested; the opening price carries the same adjustment. Fund fees are already inside these prices and are not deducted again.
- Trading cost. A spread of 1 basis point on every purchase and sale, 10 cents on a $1,000 payment. The same rate is applied to every fund, at the level of the most heavily traded ETFs, so it understates the spread on the least traded ones.
- Cash. Money that waits, under a timing rule or while a lump sum is spread, earns the 3-month Treasury bill rate less 10 basis points a year. The rate is an index rather than a fund, so a fee has to be applied by hand: 10 basis points sits between the two large Treasury-bill ETFs, SGOV at 0.07% and BIL at 0.14%.
- Inflation. US consumer prices (CPI-U, seasonally adjusted, latest revision), each month's figure applied to every day of the month.
- Window. From each fund's first price to 31 August 2026. The model-portfolio tracker runs to the latest month end.
- Taxes are not modelled. Taxes on dividends and on sales are left out of every figure. Depending on the account and the country, they can change the final outcome.
Falls and market-wide episodes
A fall is a drop of 10% or more from a fund's high to its low; it ends when the price regains the high, and one still open at the end of the data is kept. The ETFs had 621 such falls with at least a year of prices before the high, and they bottomed in 29 different calendar years, which says little about how many separate crashes there were.
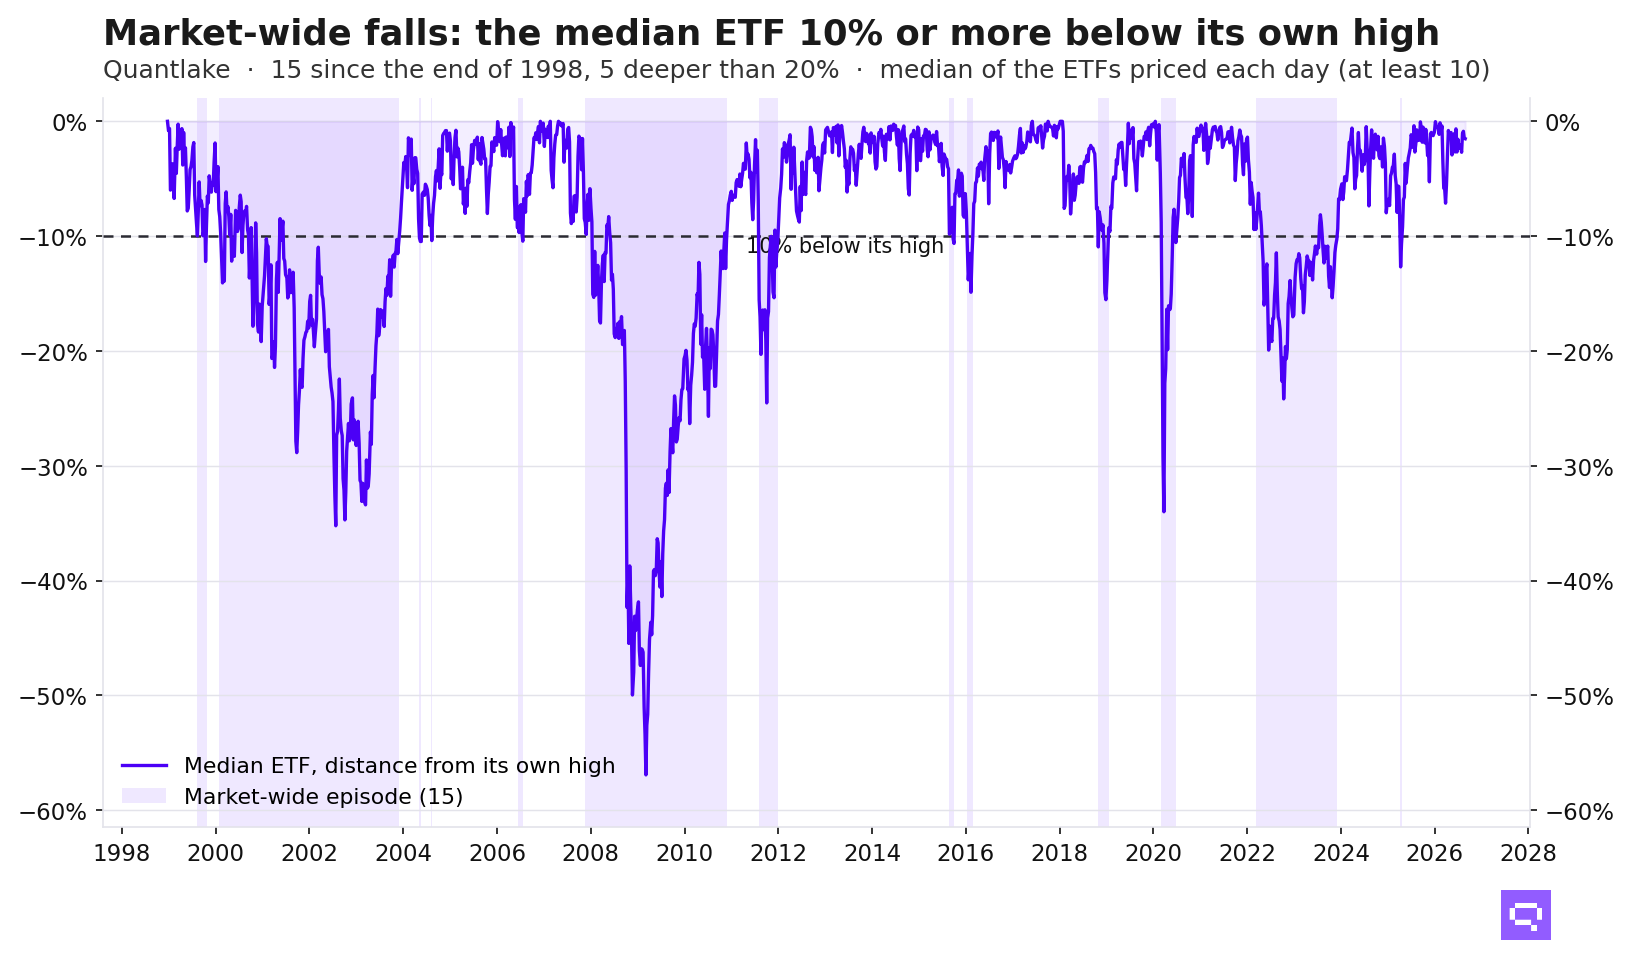
So we count market-wide episodes instead, the stretches when most of the list was down together. Each day, every ETF is measured by how far it stands below its own highest close so far, and the ETFs are lined up from least to most. The one in the middle is the median ETF: half the list is down at least as far. A market-wide episode is a run of days on which that median ETF stood 10% or more below its high. Two episodes less than three months apart count as one, and only days with at least 10 ETFs priced are used. There were 15 since the end of 1998, 5 of them deeper than 20%, and 461 of the 621 fund falls bottomed inside one.
How a "typical" figure is computed
Every figure is computed for each fund first, from one plan per starting month, and "typical" means the median, with its population named: the median fund, the median fall or the median start month. Each fund counts once, however long its history. Counting every plan once instead moves the headline figures by at most 1.8 points:
How the universe was built, and what was cut from it
Two steps, and they are worth separating. The first is the list Quantlake follows day to day: 112 US-listed ETFs, chosen for a clean split by asset class with little overlap, index funds preferred and factor styles represented. It covers US and international shares across company size (large, mid and small) and style (growth, value, dividend, quality, momentum and low volatility), US sector and single-country funds, bonds across interest-rate and credit risk, commodities, real estate, multi-asset funds and alternatives. That step is a judgement about what a diversified list needs to hold, made long before this study.
The second step is this study's own, and it is mechanical. Three rules removed 22 of the 112, reading a fund's type and length of history, never its returns:
- By type. Volatility and inverse products and currency trackers, whose price follows a futures roll or an exchange rate.
- By mandate. Thematic funds, miners, a single-commodity oil fund and cash equivalents, since the studies build plans from diversified funds. The results were also computed on the wider list before these exclusions.
- By length. ETFs with less than the five years of prices a five-year plan needs.
What is left is our ETF universe: 90 US-listed funds, all but 3 (DBMF, FTLS, JEPI) tracking an index, with yearly fees from 0.03% to 1.46%. Where several ETFs follow the same index, the list holds one: SPY for the S&P 500, without VOO or IVV. Our mutual fund universe adds 28 funds with longer histories, on the same rules.
The ETFs held $5.3 trillion of investors' money on 17 September 2026, a median of $24 billion each, the smallest CPER at $720 million. The mutual funds held $2.9 trillion across their share classes, a median of $39 billion, the smallest FGOVX at $1.4 billion. Net assets come from EODHD's fundamentals data, which carries today's figure and no history, so this is a snapshot taken on the date above, and it is never used as a weight.
Survivorship, and what these lists are made of
A fund that closed or merged is not in the data, so every fund here is one that survived to 2026. That flatters the figures, and no correction is applied.
What can be said is what the lists are made of. They hold mainstream exposures: broad indices, sectors, countries, styles and the main bond markets, with 87 of the 90 ETFs tracking an index. Thematic funds, miners, a single-commodity oil fund, volatility and inverse products and currency trackers are excluded by rule, before any result is read. Each fund carries at least five years of prices, the median ETF 21 years, and the median fund holds $24 billion.
That is not the profile of the funds that close. Of about 150 active ETFs shuttered in 2025, only six held more than $50 million at the start of that year and most held under $25 million, and the typical closed fund had existed for about 1.75 years (Morningstar, February 2026). Those figures cover active ETFs, where launches and closures are most frequent, while these lists are almost entirely index funds. The bias is smaller here than in a list drawn from every fund ever launched. It is not zero, and nothing corrects for it.
What this method does not claim
- It is not every ETF ever launched, and closed funds are not in it.
- It does not model taxes, broker commissions, ticket minimums or platform fees.
- It does not weight results by fund size, so a $700 billion fund and a $1 billion fund count alike.
- It does not blend the S&P Composite record into the fund results; that record is reported on its own.
- "Typical" is a median, not every fund and not every starting month.
- A share measured across past starting months is a frequency in this record, not a probability for one investor.
- It assumes the plan is never interrupted. A backtest does not lose its income, change its goals, need the money early or stop after a loss. These figures measure the rule as followed, and what departing from it cost is measured separately, on the pillar study.
Two returns: money-weighted and time-weighted
The money-weighted return (MWR) is the annual rate that turns each payment, counted from its own date, into the final value: the return on the investor's money, which depends on when the money went in. The time-weighted return (TWR) takes the payments out and measures the fund or portfolio itself, the figure a fund reports.
A monthly plan in a fund that falls after most of the money has gone in has an MWR below the fund's TWR. In short, the MWR is what your money earned and the TWR what the fund earned. The model-portfolio tracker quotes both side by side; elsewhere, fund returns are time-weighted and plans are measured against the money paid in.
The record since 1871 and the losing decades
Two descriptive studies sit beside the lists without joining them.
The long record runs the same monthly plan on Robert J. Shiller's S&P Composite data (shillerdata.com), January 1871 to June 2026: each month's price is the average of that month's daily closes, and one twelfth of the annual dividend is reinvested each month. Before any result was read, the total return rebuilt from his columns was checked against his own real total-return series, to within one part in a million.
This record ends earlier than the fund data above. His file carries prices past June 2026 but no dividends for those months, and a total return cannot be built without them, so the series stops where his dividends stop. The fund figures on the study pages run to 31 August 2026.
The losing decades are the ten-year windows in which a fund on the list lost money, dividends included; they stand in, in part, for the funds that closed and are missing from the data. Both are quoted in the pillar study and in the crash study, and their plans' returns are money-weighted.
Data
Prices come from EODHD end-of-day data. Each daily update checks that every recent split and dividend has reached the adjusted series before it is accepted. Treasury bill rates and consumer prices come from FRED. Net assets come from EODHD's fundamentals data.
Change log
- Version 1.0, 18 September 2026. First published: 90 ETFs and 28 mutual funds, with the selection frozen on 10 September 2026. One fund was considered and turned down along the way: RYOCX (Rydex NASDAQ-100), which would have carried the Nasdaq-100 back to 1994, has adjusted prices before 2000 that hold holiday rows at three times the surrounding price and a one-day level shift of +124.7% on 5 December 1996.
Where it is used
- Does Dollar-Cost Averaging Work? A Study on ETFs and Funds
- What a Market Crash Does to a Monthly Investment Plan
- Lump Sum vs Dollar-Cost Averaging: A Study on ETFs and Funds
- What If You Invested $1,000 a Month in an ETF Portfolio?
The full list
Every fund, by ticker, with its name and history below.
- Equity (58): ACWV, DIA, DVY, EEM, EFA, EFAV, EWG, EWJ, EWT, EWU, EWY, EWZ, FXI, IDV, IJR, IMTM, INDA, IQLT, IVLU, IWF, IWM, JEPI, MCHI, MDYG, MDYV, MTUM, QQQ, QUAL, RSP, SCHD, SDY, SLYG, SLYV, SPY, SPYG, SPYV, URTH, USMV, VB, VEA, VGK, VIG, VLUE, VO, VT, VTI, VWO, VYM, XLB, XLC, XLE, XLF, XLI, XLK, XLP, XLU, XLV, XLY
- Fixed income (12): AGG, BNDX, IEF, IEI, MBB, MUB, SHY, TIP, TLT, VGIT, VGSH, VTIP
- Credit (7): EMB, HYG, JNK, LQD, PFF, VCIT, VCSH
- Commodities (5): CPER, DBA, GLD, PDBC, SLV
- Multi-asset (3): AOA, AOM, AOR
- Real estate (3): REET, VNQ, XLRE
- Alternatives (2): DBMF, FTLS
- Mutual funds (28): FBNDX, FGOVX, LBNDX, NAESX, VBMFX, VEIEX, VEURX, VEXMX, VFICX, VFINX, VFISX, VFITX, VGSIX, VGTSX, VIGRX, VIMSX, VIPSX, VISGX, VISVX, VIVAX, VPACX, VTSMX, VUSTX, VWAHX, VWEHX, VWELX, VWESX, VWINX
The 90 ETFs
Equity (58)
| Ticker | Name | Prices from | Years |
|---|---|---|---|
| ACWV | iShares MSCI Global Min Vol Factor ETF | 2011 | 15 |
| DIA | SPDR Dow Jones Industrial Average ETF Trust | 1998 | 29 |
| DVY | iShares Select Dividend ETF | 2003 | 23 |
| EEM | iShares MSCI Emerging Markets ETF | 2003 | 23 |
| EFA | iShares MSCI EAFE ETF | 2001 | 25 |
| EFAV | iShares MSCI EAFE Min Vol Factor ETF | 2011 | 15 |
| EWG | iShares MSCI Germany ETF | 1996 | 30 |
| EWJ | iShares MSCI Japan ETF | 1996 | 30 |
| EWT | iShares MSCI Taiwan ETF | 2000 | 26 |
| EWU | iShares MSCI United Kingdom ETF | 1996 | 30 |
| EWY | iShares MSCI South Korea ETF | 2000 | 26 |
| EWZ | iShares MSCI Brazil ETF | 2000 | 26 |
| FXI | iShares China Large-Cap ETF | 2004 | 22 |
| IDV | iShares International Select Dividend ETF | 2007 | 19 |
| IJR | iShares Core S&P Small-Cap ETF | 2000 | 26 |
| IMTM | iShares MSCI Intl Momentum Factor ETF | 2015 | 12 |
| INDA | iShares MSCI India ETF | 2012 | 15 |
| IQLT | iShares MSCI Intl Quality Factor ETF | 2015 | 12 |
| IVLU | iShares Edge MSCI Intl Value Factor ETF | 2015 | 11 |
| IWF | iShares Russell 1000 Growth ETF | 2000 | 26 |
| IWM | iShares Russell 2000 ETF | 2000 | 26 |
| JEPI | JPMorgan Equity Premium Income ETF | 2020 | 6 |
| MCHI | iShares MSCI China ETF | 2011 | 15 |
| MDYG | SPDR® S&P 400 Mid Cap Growth ETF | 2005 | 21 |
| MDYV | SPDR® S&P 400 Mid Cap Value ETF | 2005 | 21 |
| MTUM | iShares MSCI USA Momentum Factor ETF | 2013 | 13 |
| QQQ | Invesco QQQ Trust | 1999 | 28 |
| QUAL | iShares MSCI USA Quality Factor ETF | 2013 | 13 |
| RSP | Invesco S&P 500® Equal Weight ETF | 2003 | 23 |
| SCHD | Schwab U.S. Dividend Equity ETF | 2011 | 15 |
| SDY | SPDR® S&P Dividend ETF | 2005 | 21 |
| SLYG | SPDR® S&P 600 Small Cap Growth ETF | 2000 | 26 |
| SLYV | SPDR® S&P 600 Small Cap Value ETF | 2000 | 26 |
| SPY | State Street® SPDR® S&P 500® ETF Trust | 1993 | 34 |
| SPYG | SPDR® Portfolio S&P 500 Growth ETF | 2000 | 26 |
| SPYV | SPDR® Portfolio S&P 500 Value ETF | 2000 | 26 |
| URTH | iShares MSCI World ETF | 2012 | 15 |
| USMV | iShares MSCI USA Min Vol Factor ETF | 2011 | 15 |
| VB | Vanguard Small-Cap Index Fund ETF Shares | 2004 | 23 |
| VEA | Vanguard FTSE Developed Markets Index Fund ETF Shares | 2007 | 19 |
| VGK | Vanguard FTSE Europe Index Fund ETF Shares | 2005 | 22 |
| VIG | Vanguard Dividend Appreciation Index Fund ETF Shares | 2006 | 20 |
| VLUE | iShares MSCI USA Value Factor ETF | 2013 | 13 |
| VO | Vanguard Mid-Cap Index Fund ETF Shares | 2004 | 23 |
| VT | Vanguard Total World Stock Index Fund ETF Shares | 2008 | 18 |
| VTI | Vanguard Total Stock Market Index Fund ETF Shares | 2001 | 25 |
| VWO | Vanguard FTSE Emerging Markets Index Fund ETF Shares | 2005 | 22 |
| VYM | Vanguard High Dividend Yield Index Fund ETF Shares | 2006 | 20 |
| XLB | Materials Select Sector SPDR® Fund | 1998 | 28 |
| XLC | Communication Services Select Sector SPDR® Fund | 2018 | 8 |
| XLE | Energy Select Sector SPDR® Fund | 1998 | 28 |
| XLF | Financial Select Sector SPDR® Fund | 1998 | 28 |
| XLI | Industrial Select Sector SPDR® Fund | 1998 | 28 |
| XLK | Technology Select Sector SPDR® Fund | 1998 | 28 |
| XLP | Consumer Staples Select Sector SPDR® Fund | 1998 | 28 |
| XLU | Utilities Select Sector SPDR® Fund | 1998 | 28 |
| XLV | Health Care Select Sector SPDR® Fund | 1998 | 28 |
| XLY | Consumer Discretionary Select Sector SPDR® Fund | 1998 | 28 |
Fixed income (12)
| Ticker | Name | Prices from | Years |
|---|---|---|---|
| AGG | iShares Core U.S. Aggregate Bond ETF | 2003 | 23 |
| BNDX | Vanguard Total International Bond Index Fund ETF Shares | 2013 | 13 |
| IEF | iShares 7-10 Year Treasury Bond ETF | 2002 | 24 |
| IEI | iShares 3-7 Year Treasury Bond ETF | 2007 | 20 |
| MBB | iShares MBS ETF | 2007 | 20 |
| MUB | iShares National Muni Bond ETF | 2007 | 19 |
| SHY | iShares 1-3 Year Treasury Bond ETF | 2002 | 24 |
| TIP | iShares TIPS Bond ETF | 2003 | 23 |
| TLT | iShares 20+ Year Treasury Bond ETF | 2002 | 24 |
| VGIT | Vanguard Intermediate-Term Treasury Index Fund ETF Shares | 2009 | 17 |
| VGSH | Vanguard Short-Term Treasury Index Fund ETF Shares | 2009 | 17 |
| VTIP | Vanguard Short-Term Inflation-Protected Securities Index Fund ETF Shares | 2012 | 14 |
Credit (7)
| Ticker | Name | Prices from | Years |
|---|---|---|---|
| EMB | iShares J.P. Morgan USD Emerging Markets Bond ETF | 2007 | 19 |
| HYG | iShares iBoxx $ High Yield Corporate Bond ETF | 2007 | 19 |
| JNK | SPDR® Bloomberg High Yield Bond ETF | 2007 | 19 |
| LQD | iShares iBoxx $ Investment Grade Corporate Bond ETF | 2002 | 24 |
| PFF | iShares Preferred and Income Securities ETF | 2007 | 20 |
| VCIT | Vanguard Intermediate-Term Corporate Bond Index Fund ETF Shares | 2009 | 17 |
| VCSH | Vanguard Short-Term Corporate Bond Index Fund ETF Shares | 2009 | 17 |
Commodities (5)
| Ticker | Name | Prices from | Years |
|---|---|---|---|
| CPER | United States Copper Index Fund LP | 2011 | 15 |
| DBA | Invesco DB Agriculture Fund | 2007 | 20 |
| GLD | SPDR® Gold Shares | 2004 | 22 |
| PDBC | Invesco Optimum Yield Diversified Commodity Strategy No K-1 ETF | 2014 | 12 |
| SLV | iShares Silver Trust | 2006 | 20 |
Multi-asset (3)
| Ticker | Name | Prices from | Years |
|---|---|---|---|
| AOA | iShares Core Aggressive Allocation ETF | 2008 | 18 |
| AOM | iShares Core Moderate Allocation ETF | 2008 | 18 |
| AOR | iShares Core Growth Allocation ETF | 2008 | 18 |
Real estate (3)
| Ticker | Name | Prices from | Years |
|---|---|---|---|
| REET | iShares Global REIT ETF | 2014 | 12 |
| VNQ | Vanguard Real Estate Index Fund ETF Shares | 2004 | 22 |
| XLRE | The Real Estate Select Sector SPDR Fund | 2015 | 11 |
Alternatives (2)
| Ticker | Name | Prices from | Years |
|---|---|---|---|
| DBMF | iMGP DBi Managed Futures Strategy ETF | 2019 | 7 |
| FTLS | First Trust Long/Short Equity ETF | 2014 | 12 |
The 28 long-history mutual funds
The first ETF starts in 1993, so every ETF plan misses the crashes before it. The mutual funds carry the same exposures further back. 8 of the 28 have prices from 1979, the start of the data; the rest start at their launch, half of them by 1990, and the youngest, VIPSX, in 2000. 25 of the 28 are Vanguard funds; 5 are actively managed (FBNDX, LBNDX, FGOVX, VWELX, VWINX). Where several funds track the same index, the one with the longest history is kept.
| Ticker | Name | Asset class | Prices from |
|---|---|---|---|
| FBNDX | Fidelity Investment Grade Bond | Credit | 1986 |
| LBNDX | Lord Abbett Bond Debenture | Credit | 1979 |
| VFICX | Vanguard Intermediate-Term Investment-Grade | Credit | 1993 |
| VWEHX | Vanguard High-Yield Corporate | Credit | 1979 |
| VWESX | Vanguard Long-Term Investment-Grade | Credit | 1979 |
| NAESX | Vanguard Small-Cap Index | Equity | 1986 |
| VEIEX | Vanguard Emerging Markets Stock Index | Equity | 1994 |
| VEURX | Vanguard European Stock Index | Equity | 1990 |
| VEXMX | Vanguard Extended Market Index | Equity | 1988 |
| VFINX | Vanguard 500 Index | Equity | 1979 |
| VGTSX | Vanguard Total International Stock Index | Equity | 1996 |
| VIGRX | Vanguard Growth Index | Equity | 1993 |
| VIMSX | Vanguard Mid-Cap Index | Equity | 1998 |
| VISGX | Vanguard Small-Cap Growth Index | Equity | 1998 |
| VISVX | Vanguard Small-Cap Value Index | Equity | 1998 |
| VIVAX | Vanguard Value Index | Equity | 1993 |
| VPACX | Vanguard Pacific Stock Index | Equity | 1990 |
| VTSMX | Vanguard Total Stock Market Index | Equity | 1992 |
| FGOVX | Fidelity Government Income | Fixed income | 1979 |
| VBMFX | Vanguard Total Bond Market Index | Fixed income | 1986 |
| VFISX | Vanguard Short-Term Treasury | Fixed income | 1991 |
| VFITX | Vanguard Intermediate-Term Treasury | Fixed income | 1991 |
| VIPSX | Vanguard Inflation-Protected Securities | Fixed income | 2000 |
| VUSTX | Vanguard Long-Term Treasury | Fixed income | 1986 |
| VWAHX | Vanguard High-Yield Tax-Exempt | Fixed income | 1979 |
| VWELX | Vanguard Wellington | Multi-asset | 1979 |
| VWINX | Vanguard Wellesley Income | Multi-asset | 1979 |
| VGSIX | Vanguard REIT Index | Real estate | 1996 |
Frequently asked questions
Related
- Does dollar-cost averaging work? A study on ETFs and funds
- What a market crash does to a monthly investment plan
- Lump sum vs dollar-cost averaging: a study on ETFs and funds
- What if you invested $1,000 a month in an ETF portfolio?
- Quantlake model portfolios: Classic and Smart
- Compound interest calculator with volatility, inflation and fees