.png)

Does Dollar-Cost Averaging Work? A Study on ETFs and Funds
The Quantlake DCA Study ran a monthly investment plan through every starting month of 90 US-listed ETFs from Quantlake's universe and 28 US mutual funds with prices back to 1979. In the typical fall of 10% or more, a plan one year old lost 69% as much as its fund, and a plan ten years old 94%. Most plans spend some time below the money paid in. No rule for timing the purchases passed a test fixed in advance.
Quantlake DCA Study · data through 31 August 2026 · updated 18 September 2026 · refreshed monthly
If you invest a fixed amount every month, three questions decide how the plan goes: how much of a crash it absorbs, how often it is worth less than the money paid in, and whether timing the purchases helps.
What is dollar-cost averaging?
Dollar-cost averaging means investing equal amounts at regular intervals, whatever the market is doing. FINRA, the US broker regulator, describes it as investing "in equal portions, at regular intervals, regardless of current market conditions" (FINRA); the academic literature uses the same definition, periodic purchases of equal dollar amounts (Constantinides, 1979, Journal of Financial and Quantitative Analysis).
A plan, in this study, is dollar-cost averaging in one fund: $1,000 invested on the first trading day of every month from a given starting month, with one plan per starting month in each fund. The exception is the three model portfolios, Bogle-, Swensen- and Buffett-Inspired, which split each payment across several ETFs.
Two things called dollar-cost averaging
The term covers two different decisions. The first is investing part of a regular income every month, whether that is a salary, a pension or rent: the money arrives over time, and the only choice is whether to invest each part when it arrives. The second is spreading a sum already in hand over several months instead of investing it on day one. Most arguments about dollar-cost averaging mix the two. This page covers the monthly plan; the lump sum has its own study, Lump Sum vs Dollar-Cost Averaging.
What this study shows
- The cushion fades as the plan grows. Of a typical decline of 10% or more, the account showed 69% at one year, 94% at ten and 98% at twenty.
- Five years in is not past the risk. The median ETF's ten-year plans dipped under their payments at some point after year five in 57% of starting months, and under those payments carried forward by prices in 76%.
- A monthly plan does not rescue a losing fund. Through the ETFs' losing decades the median plan returned −0.8% a year on the money paid in against the fund's −2.1%, and 54% of those plans ended below the money paid in.
- Timing the purchases did not pay. None of 44 rules cleared a bar fixed before the test. The best of them bought at better prices, worth +5.23%, and paid −5.07% for the months its money waited: +0.15% in all.
- The decisions around the plan moved it more. Starting five years later raised the payment needed for the same final value by 64%; a twelve-month pause in year one cost 1.8 times the money skipped.
What this page covers
- Whether monthly investing softens a crash, and for how long
- Whether a plan can still be below the money paid in after five years
- What happens when the fund itself loses money for a decade
- Whether buying the dips beat a fixed schedule, across 44 rules
- Whether a sum already in hand does better invested at once
- What 1,747 monthly plans in the S&P Composite since 1871 show
- What moved a plan's result more than the timing of its purchases
- What a backtest assumes about the investor, and what it cannot measure
Does dollar-cost averaging reduce risk?
A fixed monthly amount buys more shares when prices are low and fewer when they are high, with no forecast involved. Its measurable effect is on a crash early in the plan.
A fall, or decline, is a drop of 10% or more from a fund's highest close to its lowest close before it regained that high. Our study measured 621 such declines across the ETFs, each against a plan started a year before the fund's high; 461 of them bottomed inside one of 15 market-wide episodes, stretches when the median ETF stood 10% or more below its own high. "Typical" on this page means the median, and each figure names its population; here, those declines.
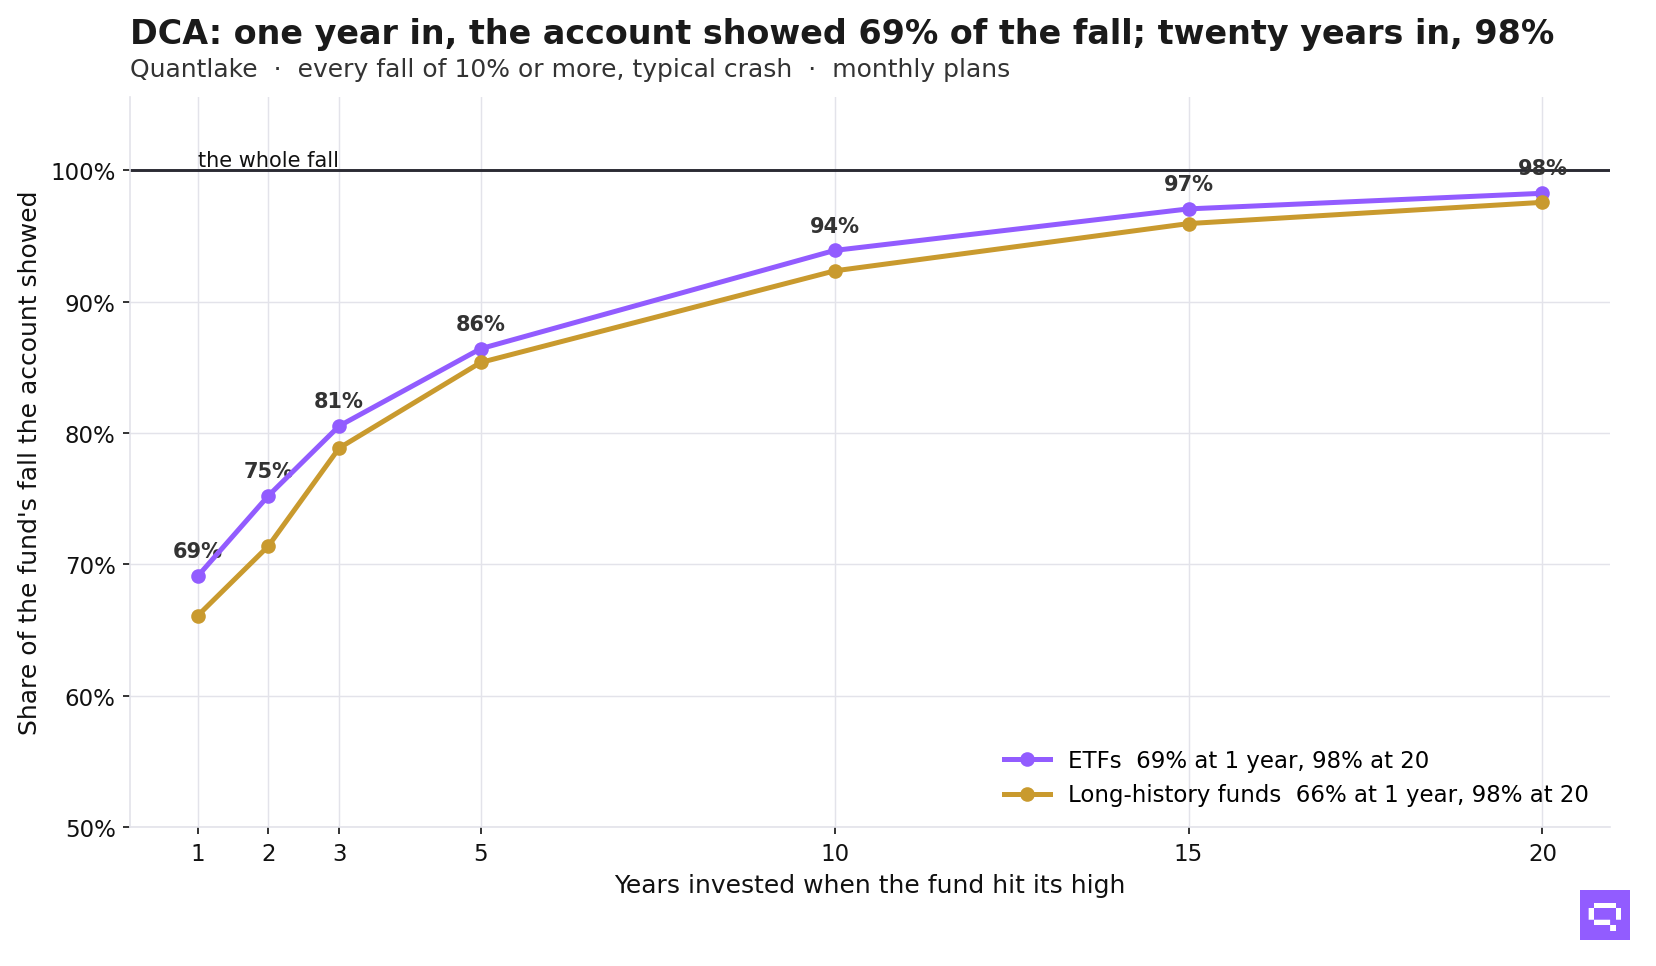
In the typical decline, a plan that had been running for a year when its fund peaked lost 69% as much as the fund: a 20% drop in the fund meant a drop of about 14% in the account. Two things make the difference: the payments made during the decline add new money to the account, and they buy at lower prices.
SPY (S&P 500) fell 55.2% from its high on 9 October 2007 to its low on 9 March 2009. A plan started one year before the high fell 33.9% over the same months; a plan started ten years before fell 49.4%.
What it does not do
It does not protect a mature plan
The cushion fades as the account grows. In the typical decline, a plan ten years old lost 94% as much as its fund, and a plan twenty years old 98%. The long-history mutual funds show the same curve: 66% one year in, 98% twenty years in.
It does not keep the account above the money paid in
Nearly every plan is worth less than the money paid in on some day of its first year, because its first payments have had no time to grow. The figures below measure how long that risk lasts. We started a ten-year plan in every month of every fund old enough for one: 85 of the 90 ETFs, the other 5 being too young. That makes 11,395 ten-year plans in all. Each fund is summarised on its own plans first, and the figures below are the middle fund's, so no single fund can carry them.
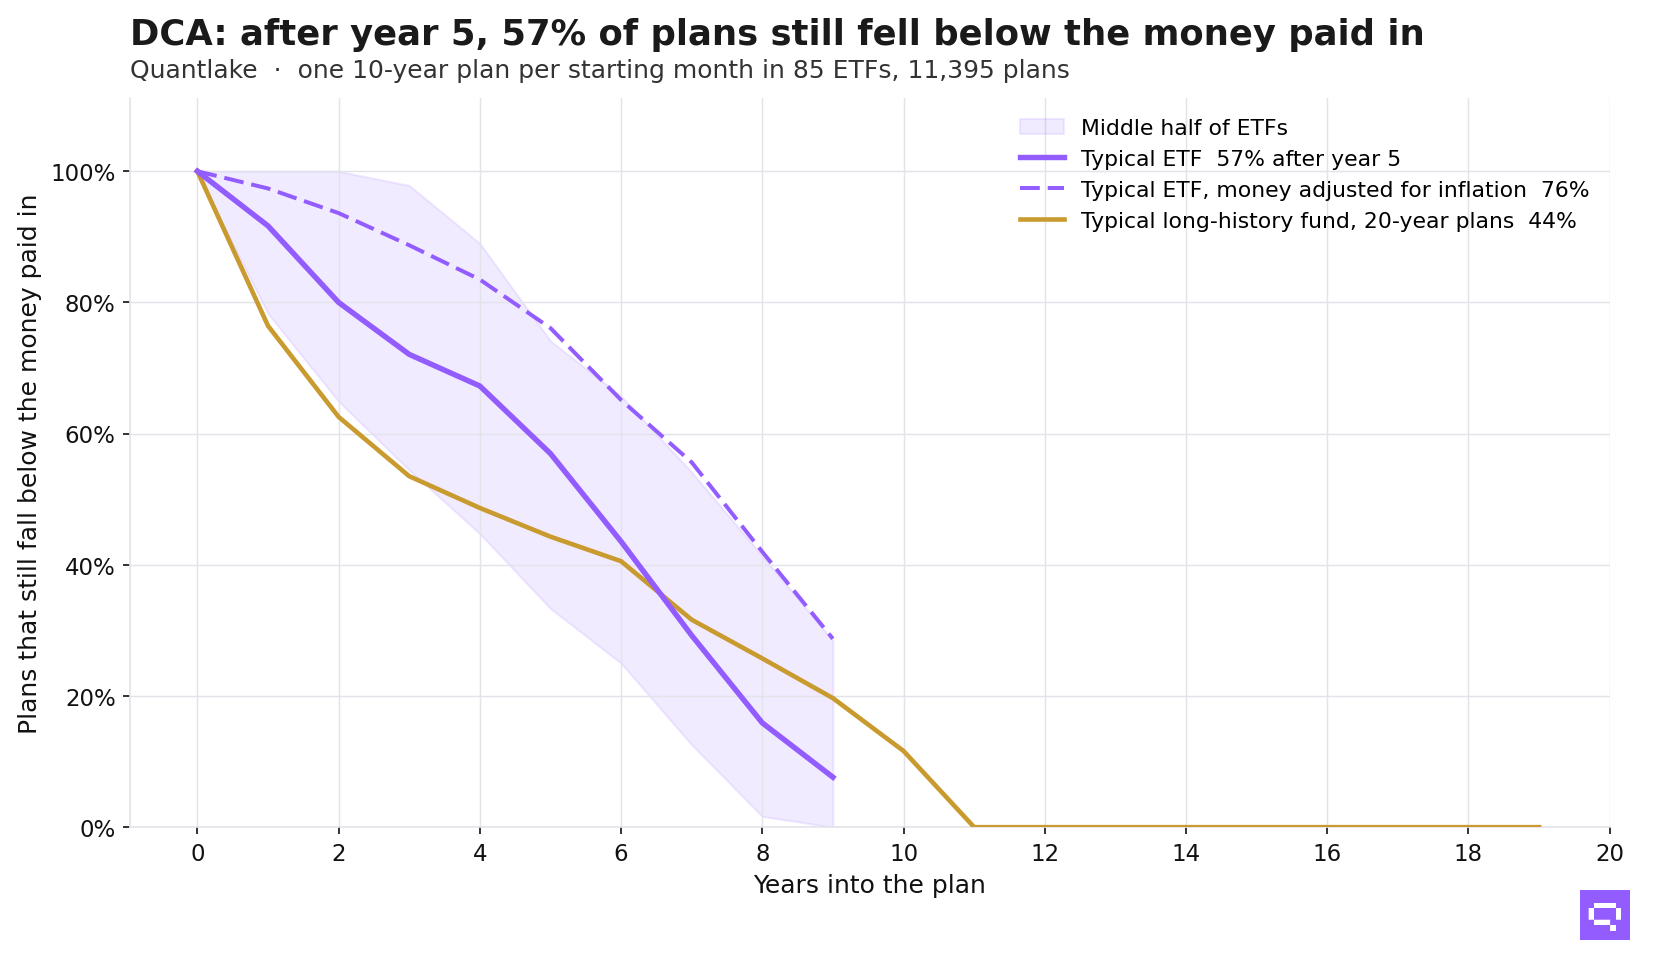
In the median ETF, 92% of the ten-year plans dipped below the money paid in at some point after their first year. After their fifth year, 57% still did, and after their ninth, 8%. Those late dips went deep: the plans that fell below after year five bottomed at a median 12.7% under the money paid in. The long-history funds ran twenty-year plans, and in the median fund 12% still fell below after year ten, none after year eleven.
The starting date moves this figure more than anything else. In the median long-history fund, no plan started in the 1980s fell below the money paid in after its third year. Of the plans started in the 1990s, 70% still did after year five; of those started in the 2000s, 68%.
What the 1990s plans had in common was the price they paid. A monthly plan in the Vanguard 500 fund started in January 1996 had made 65 of its 82 payments at prices above the fund's close on 9 October 2002, the low of the 2000-02 fall. What a Market Crash Does to a Monthly Investment Plan shows the three decades side by side.
Inflation makes the test stricter. Carry each payment forward by the rise in consumer prices, and the benchmark becomes what the money would have to be worth today to buy what it bought then. Against that benchmark, 76% of the median ETF's ten-year plans still fell below after year five, with a median low point 19.0% under it.
The table holds two different measures. One is whether a plan was below the money paid in on that anniversary itself; the other is whether it fell below at any point after it. At five years the first is 6% of starting months and the second 57%.
The median plan in the median ETF spent 7.5% of its days under its payments, and 14.5% after inflation.
Ending there is rarer than dipping there. The median ETF had no ten-year plan finish under its payments. Averaged across all 85 ETFs, 4.9% did, and those sit in a few funds (the share of each fund's plans in brackets): DBA (Agriculture Basket) 51%, MCHI (China) 45%, SLV (Silver) 40%, EWZ (Brazil) 29%, FXI (China Large Cap) 29%, TLT (Long Treasuries) 28%. After inflation, 7.5% of the median ETF's plans ended below, and 20.1% averaged across ETFs.
Sitting under the payments is a normal part of a plan's first years. A deep crash after years of buying at higher prices can bring it back a decade in.
It does not rescue a fund that loses for a decade
Every fund in this study still exists; funds that closed after a bad decade are missing. What the data does hold is the survivors' own losing decades: ten-year windows in which the fund lost money, dividends included.
4.9% of the ten-year ETF plans, 559 of them, ran through one, in 27 ETFs, most often DBA (Agriculture Basket), XLF (Financials), EWZ (Brazil) and SLV (Silver).
Across those plans the median fund return was −2.1% a year and the median plan return −0.8% a year on the money paid in. 54% of them finished under their payments.
A plan finishes above its payments when its last price is above the average price it paid per share. Where the fall sits in the decade therefore decides the result.
A ten-year plan in the S&P Composite started at the September 1929 peak made 86 of its 120 payments after the June 1932 low. The index returned −36.4% over those ten years; the plan ended +32.4% on the money paid in.
A plan started in July 1922 ended at that low, and every payment but its last was made above the price it ended at. The index returned −3.7% over its ten years; the plan ended −47.1%.
Timing the purchases did not beat the schedule
We tested 44 rules that change when the monthly money goes in. Four of them, to show the kind:
- Hold the month's money in Treasury bills until the fund is 10% or more below its highest close, then buy.
- Buy only while the price is above its 200-day average, and wait while it is below.
- Buy when the 14-day relative strength index is above 60, the level that marks a fund as firmly strong.
- Buy when the fund's recent volatility sits below its own past-year norm, on the view that calm markets are better entries.
The set also holds rules with no market condition at all, such as holding each payment to the last trading day of the quarter, as a control.
The bar was fixed before the test, and a rule had to clear all four parts of it:
- a gain across the funds whose confidence interval stayed above zero;
- a result beyond 90% of randomly shifted versions of the same rule;
- a gain of at least 2% of final wealth and 15 basis points a year;
- a result in the same direction on both halves of the ETFs, the half used to design the rules and the half held back to check them.
None of the 44 cleared it.
Buying after falls does get better prices. One rule kept each month's money in Treasury bills until the fund stood at least one year's worth of its own volatility below its highest weekly close, then invested everything held. Its better prices added +5.23% to final wealth over five-year plans; the months its money spent waiting cost −5.07%. Averaged across the ETFs it was tested on, the two netted to +0.15%: the better prices paid for the waiting, and little more.
The ride was smoother. In the median ETF of the 81 it ran on, the rule's deepest decline was 6.5 points shallower than the plain schedule's, and 98% of its plans fell less far. That came with a median 43% of the account waiting in Treasury bills.
The calm came from that cash rather than from the signal. Against a plan holding the same share in cash and investing the rest on schedule, the smoother ride almost disappeared: the Ulcer Index, which measures how deep and how long a plan stays below its high, improved by 3.7 points against the schedule and by 0.10 against the same-cash plan.
Is it better than investing a lump sum?
With the money already in hand, investing it all at once beat feeding it in over twelve months in 69% of starting months, averaged across the 90 ETFs and measured five years later. In the median ETF's median start, spreading cost 3.2% of final wealth and cut the deepest dip of the first year, in the median start, from 5.6% to 2.7%.
The record since 1871
The ETF prices in this study start in 1993 and the mutual funds in 1979. Robert J. Shiller's monthly data on the S&P Composite, the index behind the S&P 500, runs from January 1871 to June 2026 with its dividends, so a plan can be started before 1929, before the 1970s and before every crash since. The same $1,000 monthly plan was run on it, one plan per starting month. The return shown is money-weighted: the yearly rate that turns the payments into the final value.
There is no single "the market returns" figure for a monthly plan. The same plan, started in a different month, returned very different rates a year:
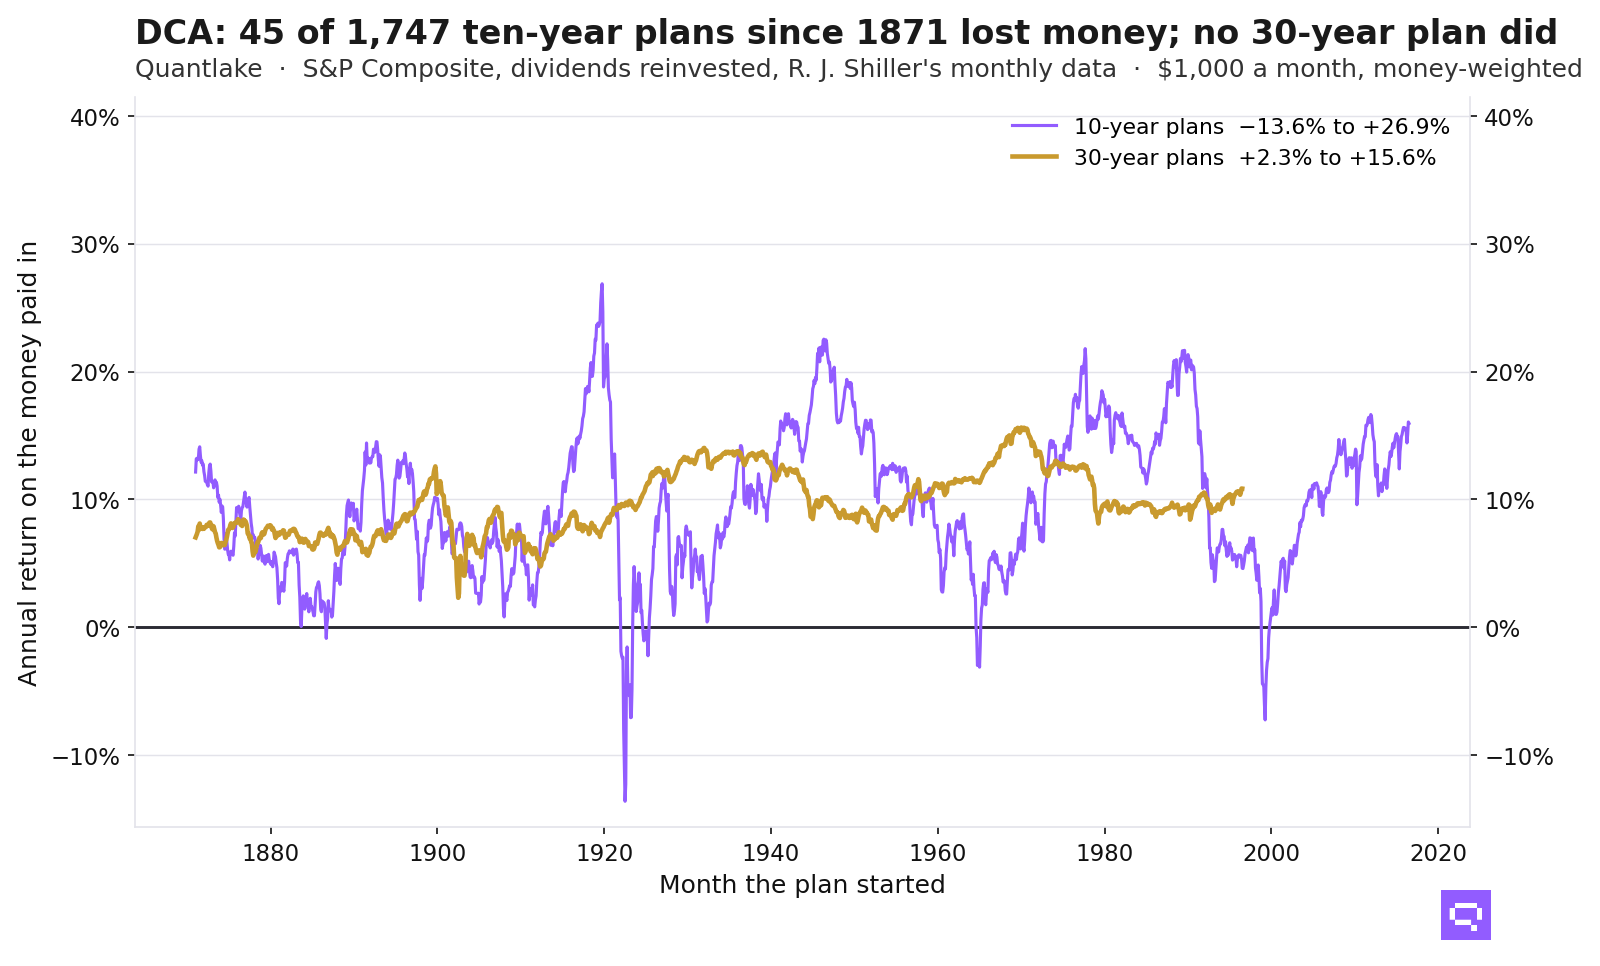
Ten-year plans ran from −13.6% to +26.9% a year, and the middle eight in ten of them from +2.8% to +16.8%. Thirty years narrowed the range without closing it: +2.3% to +15.6%, the middle eight in ten from +6.7% to +13.2%. The worst ten-year plan started in July 1922, and the worst thirty-year plan in July 1902. A ten-year plan was still below the money paid in at some point after its fifth year in 38% of starting months.
The decade a plan started in decided much of the rest. Ten-year plans started in the 1920s finished under their payments 22% of the time, the highest share of any decade; against the money paid in carried forward by inflation, 63% of those started in the 1960s did.
Three limits travel with these figures. They are monthly averages of daily prices, which smooth each low; the index charges no fund fee; and it is one country's market.
What moves the result more than timing?
Three decisions around the plan moved its result more than any timing rule: when it starts, whether it pauses, and whether it stops in a decline. The first two are for the median of 31 long-history funds on twenty-year plans (the 28 plus 3 duplicate share classes).
- Starting later. Waiting one year to start raised the monthly amount needed to reach the same final value by the same date by 10%; waiting two years, by 20%; five years, by 64%.
- Pausing early. A twelve-month pause in the first year cost 1.8 times the money skipped, because that money would have compounded for nineteen more years. The same pause in year nineteen cost 0.4 times.
- Stopping in a decline. On five-year plans, stopping purchases after a fall of 20%, 30% or 40% and restarting only when the price regained its old high ended 2.4% to 2.8% of final wealth behind stopping for the same length of time on random dates, averaged across the ETFs.
Each of these costs more than the buy-after-a-fall rule above gained (+0.15%): the decisions around the plan move its result more than the timing of the purchases inside it.
What a backtest assumes about the investor
Every plan on this page pays in on the first trading day of every month and never misses one. That is an assumption about the investor rather than a finding about the market.
The three figures above are what departing from the schedule cost in this record. A five-year wait to start raised the payment needed for the same final value by 64%. A twelve-month pause in year one cost 1.8 times the money skipped. Stopping in a fall until the old high returned ended 2.4% to 2.8% of final wealth behind. Measured the same way, as a share of final wealth on five-year plans, the best of the 44 timing rules moved the result by +0.15%.
So the same prices answer two questions. One is what the market did to a plan that was followed. The other is what not following it cost.
What the prices cannot answer is why a plan stops. Income stops, a house is bought, the money is needed before the plan ends, and what suited a saver at the start can stop suiting them. A plan that was never affordable for twenty years is not described by any figure here at any horizon. These results measure the rule, and the rule is one part of what an investor is choosing.
Why a fall makes an investor pause or stop, and why spreading a sum feels safer than investing it at once, is the subject of Why Investors Choose Dollar-Cost Averaging.
See it applied to three portfolios
Three Quantlake Classic model portfolios, each a fixed mix of ETFs bought for $1,000 a month, are backtested to August 2026. From January 2010, $200,000 became $661,045 in Bogle-Inspired and $458,463 in Swensen-Inspired; from January 2003, $284,000 became $1,473,913 in Buffett-Inspired, 90% S&P 500 and 10% short-term Treasuries. The model-portfolio tracker is updated once a month.
Method and limits
- Universe. The Quantlake ETF Universe: 90 US-listed ETFs, priced from 1993 or their launch. 58 are equity funds, US and international, broad, sector, country, factor and dividend (SPY, QQQ, VTI, IWM, EFA, VEA, VWO among them); 12 hold Treasury, TIPS, mortgage, municipal or aggregate bonds (AGG, IEF, TLT, TIP); 7 hold corporate, high-yield, emerging-market or preferred debt (LQD, HYG, EMB); 5 are commodity funds (CPER, DBA, GLD, PDBC, SLV); 3 real estate, 3 multi-asset and 2 alternatives. All but 3 (DBMF, FTLS, JEPI) track an index. Beside them, 28 US mutual funds priced from 1979, 25 of them Vanguard funds. The methodology page lists every fund, the selection rules and what was left out.
- Weighting. Each fund counts once: its plans are summarised first, then the median fund is taken. Counting every plan once instead moves the headline shares by at most 1.8 points.
- Plans. $1,000 in one fund on the first trading day of each month, bought at the open for ETFs and at the day's net asset value for mutual funds, with a 1 basis point spread; money waiting under a timing rule earns Treasury bills less 10 basis points. One plan per starting month; five-year plans unless stated.
- Inflation. US consumer prices (CPI-U, seasonally adjusted, latest revision), each month's figure applied to every day of that month.
- Overlap. Plans started a month apart share most of their history, and most falls belong to a few market-wide episodes: 15 since the end of 1998, listed on the methodology page. The episodes are the honest sample size.
- Survivorship. Every fund here exists today. Funds that closed after a loss are missing, which flatters the figures; the surviving funds' own losing decades stand in for them only in part.
- The long record. R. J. Shiller's monthly S&P Composite data (shillerdata.com), January 1871 to June 2026, where his dividend column ends and so the series does: each month's price is the average of its daily closes, one twelfth of the annual dividend is reinvested each month, and the 1 basis point spread applies with no fund fee.
- Taxes are not modelled. Taxes on dividends and on sales are left out of every figure. Depending on the account and the country, they can change the final outcome.
- The behavioral side. Why an investor chooses to spread a sum rather than invest it at once, through loss aversion, regret and self-control, is in Why Investors Choose Dollar-Cost Averaging. Nothing on this page measures it.
Frequently asked questions
Related
- What a market crash does to a monthly investment plan
- What if you invested $1,000 a month in an ETF portfolio?
- Lump sum vs dollar-cost averaging: a study on ETFs and funds
- Quantlake studies: the ETFs and funds tested, and the method
- Why investors choose dollar-cost averaging
- Quantlake model portfolios: Classic and Smart
- Compound interest calculator with volatility, inflation and fees