.png)

Lump Sum vs Dollar-Cost Averaging: A Study on ETFs and Funds
In the Quantlake DCA Study, with a sum already in hand, investing it at once ended ahead of spreading it over twelve months in 69% of starting months, averaged across 90 ETFs and measured five years later. In the median ETF's median start, spreading cost 3.2% of final wealth and cut the deepest dip of the first year from 5.6% to 2.7%.
Quantlake DCA Study · data through 31 August 2026 · updated 18 September 2026 · refreshed monthly
If you have a sum to invest, the choice is between putting it all in at once and feeding it in over months.
One sum: invest it at once, or spread it out?
The sum here is one already in hand: an inheritance, a bonus, the sale of a house. Spreading it means dollar-cost averaging for a short time: investing equal amounts at regular intervals, whatever the market is doing.
It is either invested on day one or split into equal parts invested at the start of each month for 6, 12, 24 or 36 months, with the waiting money in Treasury bills less 10 basis points. Both are compared five and ten years after day one, for every starting month of 90 ETFs since 1993 or their launch and 28 long-history mutual funds.
Each fund is summarised across its own starting months first. A share such as "69% of starting months" is then the average of those fund shares, and a "typical" figure is the median of the fund medians, so no single fund carries the result.
The trade-off
- Invest at once: every dollar is exposed from day one, to the market's returns and to a decline that starts the next week.
- Spread it out: less is exposed to an early decline, and the money still waiting earns Treasury bills instead of the fund.
The rest of this page puts sizes on both sides.
What this study shows
- Investing at once finished ahead more often, at every length tested. Against six months of spreading it came out in front in 67% of starting months, and against thirty-six in 76%.
- Spreading cut the early loss and cost final wealth. Twelve months of it took the deepest first-year dip in the median start from 5.6% to 2.7% and cost 3.2% of final wealth five years on. Each further year of spreading removed less loss for more cost.
- Commodities were the exception, on 5 funds only: spreading gained +1.10% there, where the funds' returns barely cleared the cash the waiting money earned.
Is a lump sum better than dollar-cost averaging?
At every length investing at once was ahead in most starting months, and against twelve months of spreading it was ahead in most starting months of 96% of the ETFs taken one by one. The longer the spreading, the more often it lost, because more of the money waited longer.
A 69% share is a frequency across past starting months, not a probability for one investor. An investor with one sum gets one starting month, and that month may be any of them.
Investing income as it arrives rather than spreading a sum is the other question: what 90 ETFs and 28 funds show about monthly investing.
What spreading costs
In the typical start, spreading over six months cost 1.9% of final wealth five years later; over thirty-six months, 8.1%. Measured ten years on instead of five, twelve months of spreading cost 3.2%.
The range around that is wide. Over twelve months, the median ETF's worst tenth of starts cost 11.6% or more, and its best tenth gained 7.1% or more.
The cost is the gap between what the funds earned and what the waiting cash earned. Over their histories to August 2026 the median ETF returned 7.7% a year against 1.8% for Treasury bills, and 89 of the 90 beat the bills. The 1 that did not were VGSH (Short Treasuries), 1.42% a year against 1.44%.
What spreading buys
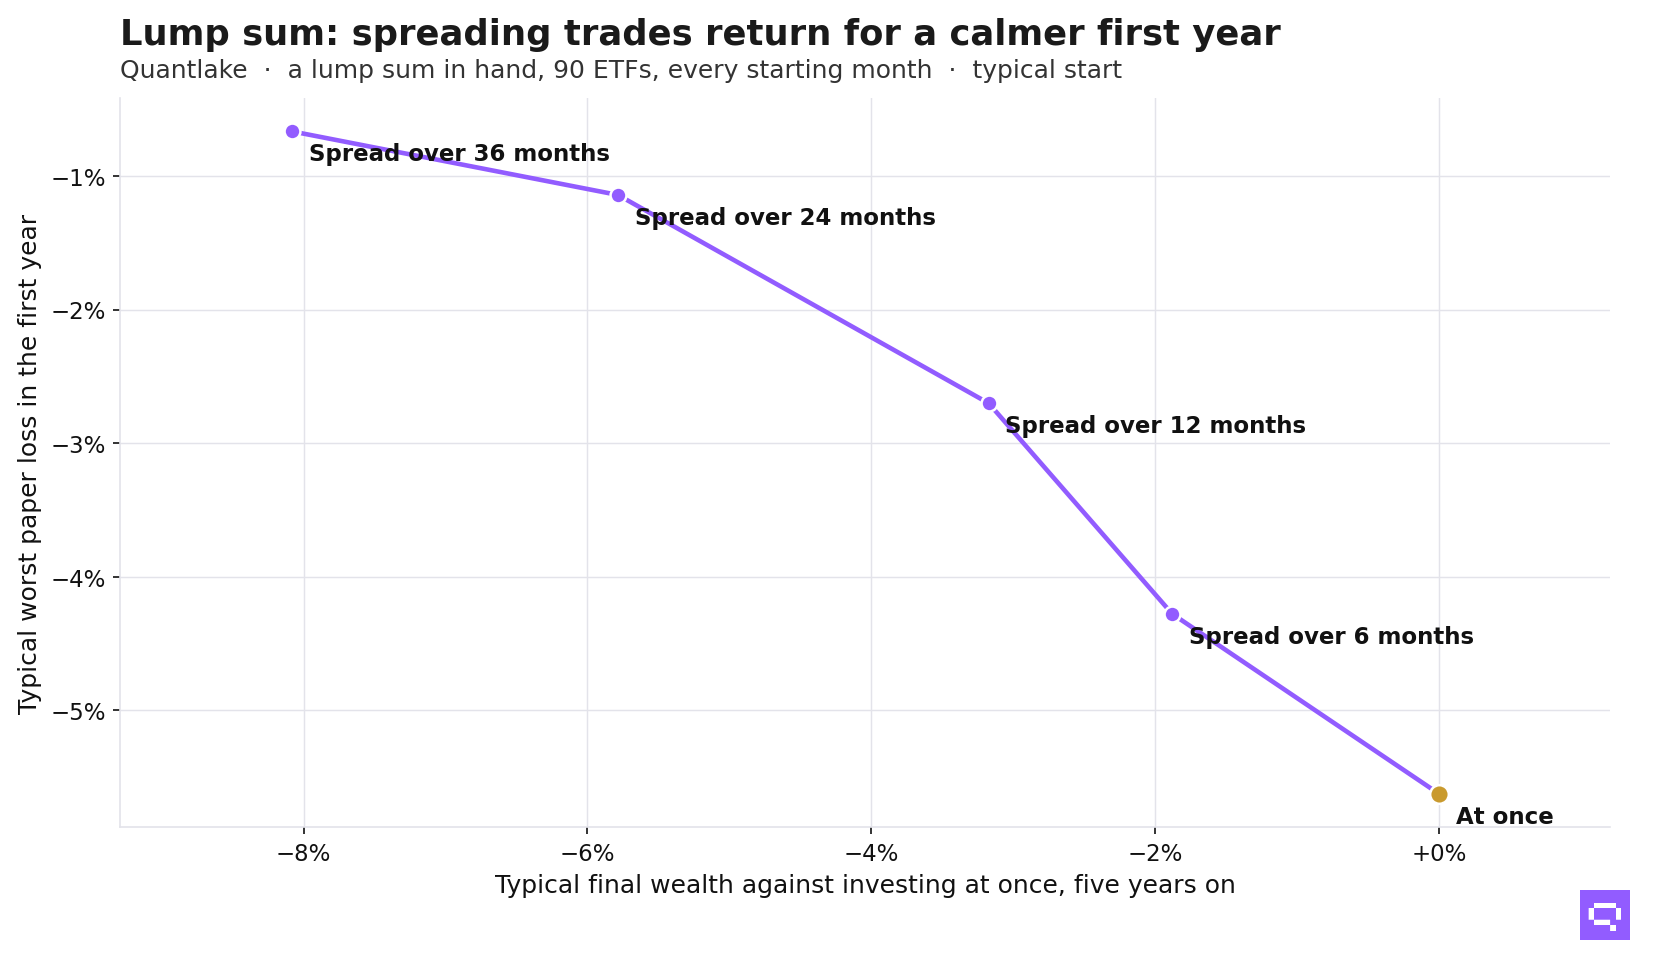
Invested at once, the deepest dip of the first year was 5.6% in the median start, and 27.1% or more in one start in ten; spread over twelve months, the one-in-ten figure fell to 15.4%. In the typical start, spread over six months, 4.3%; over twelve, 2.7%; over thirty-six, 0.7%. Spreading is insurance against an early loss, and each point of cover costs more the longer it runs: 1.1% of final wealth per point of first-year loss removed in the first year of spreading, 1.7% in the second, 4.8% in the third.
Each extra year of spreading therefore removed less of the early loss and gave up more market exposure to do it. Most of the protection is bought in the first year.
What this comparison assumes
Both sides of the table assume the money stays in the fund for the whole five years. Nothing here prices what happens when it does not.
The costs it does price are close in size. Spreading over twelve months cost 3.2% of final wealth in the typical start. The same study, on monthly plans rather than lump sums, priced one departure from a plan: stopping purchases in a fall and restarting only at the old high ended 2.4% to 2.8% of final wealth behind stopping for as long on random dates.
So spreading is not the unreasonable choice here, and it is not a free one: 3.2% of final wealth to take the deepest first-year dip from 5.6% to 2.7%. What settles whether that is worth paying is what the holder of the sum does in the first year, and no figure in this study measures that. Why a first-year loss changes what an investor does is the subject of Why Investors Choose Dollar-Cost Averaging.
By asset class
The 90 ETFs split into 7 asset classes, as defined on the methodology page. 58 are equity funds. Fixed income holds bonds whose main risk is interest rates: Treasury, TIPS, mortgage, municipal and aggregate. Credit holds bonds whose main risk is the borrower: corporate, high-yield, emerging-market and preferred.
Then commodities, real estate, multi-asset allocation funds, and alternatives, a managed-futures fund (DBMF) and a long/short equity fund (FTLS). Twelve months of spreading, five years on:
Equities followed the overall pattern: at once ahead in 69% of starts, with the median start's deepest first-year dip falling from 7.1% to 3.5% when spread. In every class but one, investing at once ended ahead in 69% to 81% of starting months.
Commodities were the exception. Investing at once led in only 48% of starts there, and spreading gained +1.10%. The reason is in the returns: the 5 commodity ETFs (CPER (Copper), DBA (Agriculture Basket), GLD (Gold), PDBC (Broad Commodities), SLV (Silver)) returned a median 4.4% a year over their histories, against 1.8% for the Treasury bills the waiting money earned, so holding money back cost little. That rests on 5 funds, against 58 equity funds, and is the thinnest row in the table.
Method and limits
- Universe. The Quantlake ETF Universe: 90 US-listed ETFs, priced from 1993 or their launch. 58 are equity funds, US and international, broad, sector, country, factor and dividend (SPY, QQQ, VTI, IWM, EFA, VEA, VWO among them); 12 hold Treasury, TIPS, mortgage, municipal or aggregate bonds (AGG, IEF, TLT, TIP); 7 hold corporate, high-yield, emerging-market or preferred debt (LQD, HYG, EMB); 5 are commodity funds (CPER, DBA, GLD, PDBC, SLV); 3 real estate, 3 multi-asset and 2 alternatives. All but 3 (DBMF, FTLS, JEPI) track an index. Beside them, 28 US mutual funds priced from 1979, 25 of them Vanguard funds. The methodology page lists every fund, the selection rules and what was left out.
- Mechanics. Purchases on the first trading day of each month, at the open for ETFs and at the day's net asset value for mutual funds, with a 1 basis point spread; waiting money in Treasury bills less 10 basis points, so spreading earned more in years of high interest rates.
- Regret measure. The deepest paper loss during the first year, on the whole sum, invested and waiting parts together, for each starting month. The pages quote it for the median start and for the one-in-ten start, since the median alone describes a quiet year.
- Overlap and survivorship. Starting months a month apart share most of their history; every fund here exists today.
- Taxes are not modelled. Taxes on dividends and on sales are left out of every figure. Depending on the account and the country, they can change the final outcome.
Frequently asked questions
Related
- Does dollar-cost averaging work? A study on ETFs and funds
- What a market crash does to a monthly investment plan
- What if you invested $1,000 a month in an ETF portfolio?
- Quantlake studies: the ETFs and funds tested, and the method
- Why investors choose dollar-cost averaging
- Quantlake model portfolios: Classic and Smart
- Compound interest calculator with volatility, inflation and fees