.png)

What a Market Crash Does to a Monthly Investment Plan
A market crash reaches a monthly plan in proportion to how much is already invested. In the Quantlake DCA Study, across 90 ETFs and 28 long-history funds, in the median fall a plan one year old showed 69% of the fund's drop, and a plan twenty years old showed 98%.
Quantlake DCA Study · data through 31 August 2026 · updated 18 September 2026 · refreshed monthly
If a crash is what worries you about investing, a monthly plan never puts all the money in at one price. This page measures how much of a crash still reached monthly plans, and why the answer depends on how long the plan had been running.
Dollar-cost averaging means investing equal amounts at regular intervals, whatever the market is doing. FINRA, the US broker regulator, describes it as investing "in equal portions, at regular intervals, regardless of current market conditions" (FINRA); the academic literature uses the same definition, periodic purchases of equal dollar amounts (Constantinides, 1979, Journal of Financial and Quantitative Analysis).
A plan, in this study, is dollar-cost averaging in one fund: $1,000 invested on the first trading day of every month from a given starting month, with one plan per starting month in each fund. The exception is the three model portfolios, Bogle-, Swensen- and Buffett-Inspired, which split each payment across several ETFs.
What this study shows
- Crash depth sets the size of the loss; plan age sets how much of the crash reaches the account. Both were measured across 2,933 account falls.
- The cushion is an early-years effect. One year in, the account showed 69% of its fund's median drop; twenty years in, 98%.
- Reacting to a fall cost money. Pausing for twelve months in year one of a twenty-year plan gave up 1.8 times the amount skipped, and waiting for the old high before buying again trailed an equally long pause taken on random dates.
How much of a crash does a monthly plan feel?
A fall, or decline, is a drop of 10% or more from a fund's highest close to its lowest close before it regained that high. An account that is still receiving money falls less than its fund, for two reasons: the payments made during the decline add new money to the account, and they buy at lower prices. How much less depends on how long the plan has been running.
Each decline was measured against plans started one to twenty years before the fund's high. "Typical" means the median: across those declines in the two tables, across funds after them.
New money is what makes the difference, and it counts for most when there is least beside it. One payment against a first year's savings moves the account; the same payment against twenty years of it barely registers, so a mature account falls with its fund.
621 declines is not 621 crashes: 461 of them bottomed inside one of 15 market-wide episodes, listed on the methodology page. The episodes are the honest sample size.
How far did the account fall?
Look up the plan's age at the fund's high and the size of the fall. Each cell is the median account fall.
n/a: the declines in that cell bottomed in fewer than three different years, too few to report.
Depth sets the fall, age sets the share
The two measures answer different questions. Across 2,933 account falls, every ETF fall paired with each plan age from one to twenty years, the depth of the fund's fall explained 85% of the variation in how far the account fell, while the plan's age explained 30% of the variation in the share of that fall the account showed.
The same plan in a deeper crash loses more; an older plan in the same crash loses a larger part of it. The model-portfolio tracker carries the measure forward each month on three real allocations.
How long can a plan stay below the money paid in?
Being below the money paid in is a different measure from a fall. A plan can fall 20% from its high and still be worth more than was paid in; a young plan can be below the money paid in after a fall of a few percent.
A ten-year plan was started every month in the 85 ETFs old enough for one (the other 5 of the 90 are younger). In the median ETF, 25% of plans were below the money paid in at the end of year one, 6% at the end of year five and 0% at the end of year ten.
Counting any day rather than the anniversary, 57% fell below at some point after year five, bottoming at a median 12.7% under the money paid in; the median plan's last day below came 5.4 years in. Against payments carried forward by inflation, 76% fell below after year five.
What puts a plan there so late is one kind of history: a deep fall after years of buying at higher prices, as in 2000-02 and 2008-09. By then the account holds more than the next payments can offset.
A share of 0% counts past starting months only. In the S&P Composite since 1871, 45 of 1,747 ten-year plans ended below the money paid in, most of them started in the 1920s.
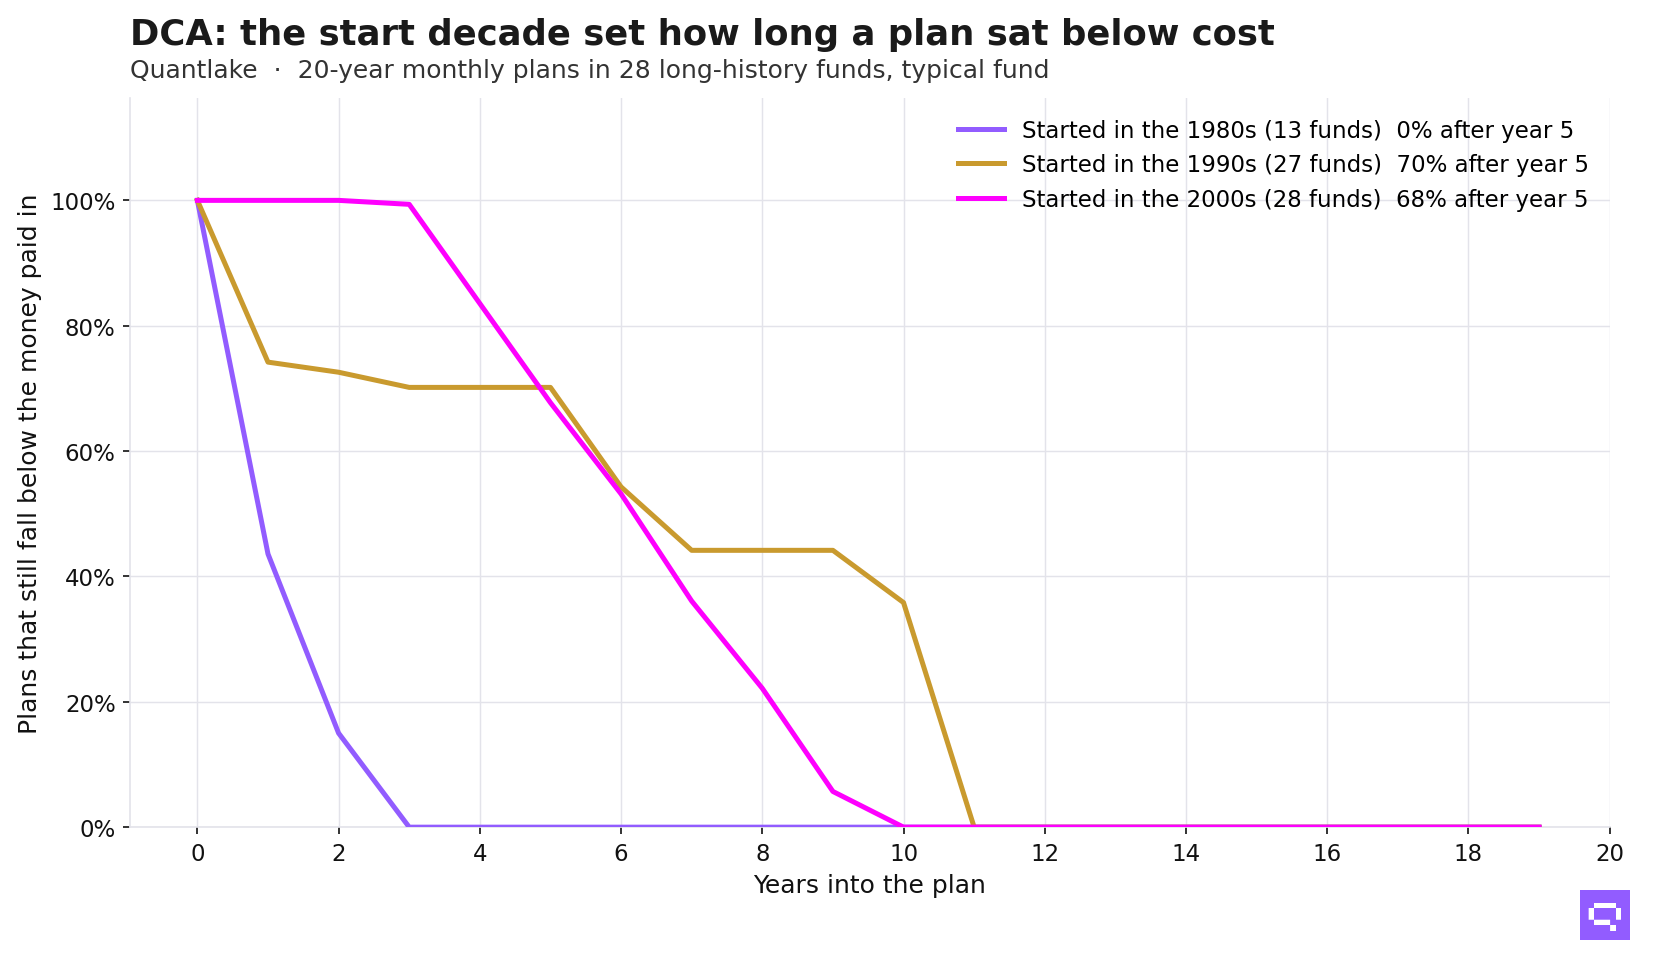
In the median long-history fund, no plan started in the 1980s fell below the money paid in after its third year, while 70% of plans started in the 1990s did after their fifth.
What past crashes did to a monthly plan
Robert J. Shiller's monthly data on the S&P Composite carries the same measure back to 1871 (the record is in the pillar study), through every crash with a name. Six of them, with the account fall of a monthly plan by its age at the high:
The 1929-32 fall lasted 33 months, so a plan one year old at the peak made 33 more payments on the way down; its account fell 38.0% against the index's 81.8%. A plan twenty years old fell 80.9%.
That gap is not protection on the money already invested, which fell with the index. Most of the younger plan's eventual capital had not gone in at the peak, and what went in during those 33 months bought at prices on the way down.
How much of a crash a one-year-old plan showed varied widely, from 13% of the 2022 inflation shock to 63% of the COVID crash. The COVID crash lasted 1 month on monthly averages, so the plan made only one payment on the way down. Length alone did not decide it: the 1929 fall lasted 33 months and the same plan still showed 46% of it.
Starting in the 1920s still marked a plan. Ten-year plans started then ended below the money paid in 22% of the time, the highest share of any decade since 1871; those started in the 1990s, 10%. Monthly averages smooth each high and low, so no fall in the table is deeper than it was on daily closes, and the shortest are understated most.
Two reactions and what they cost
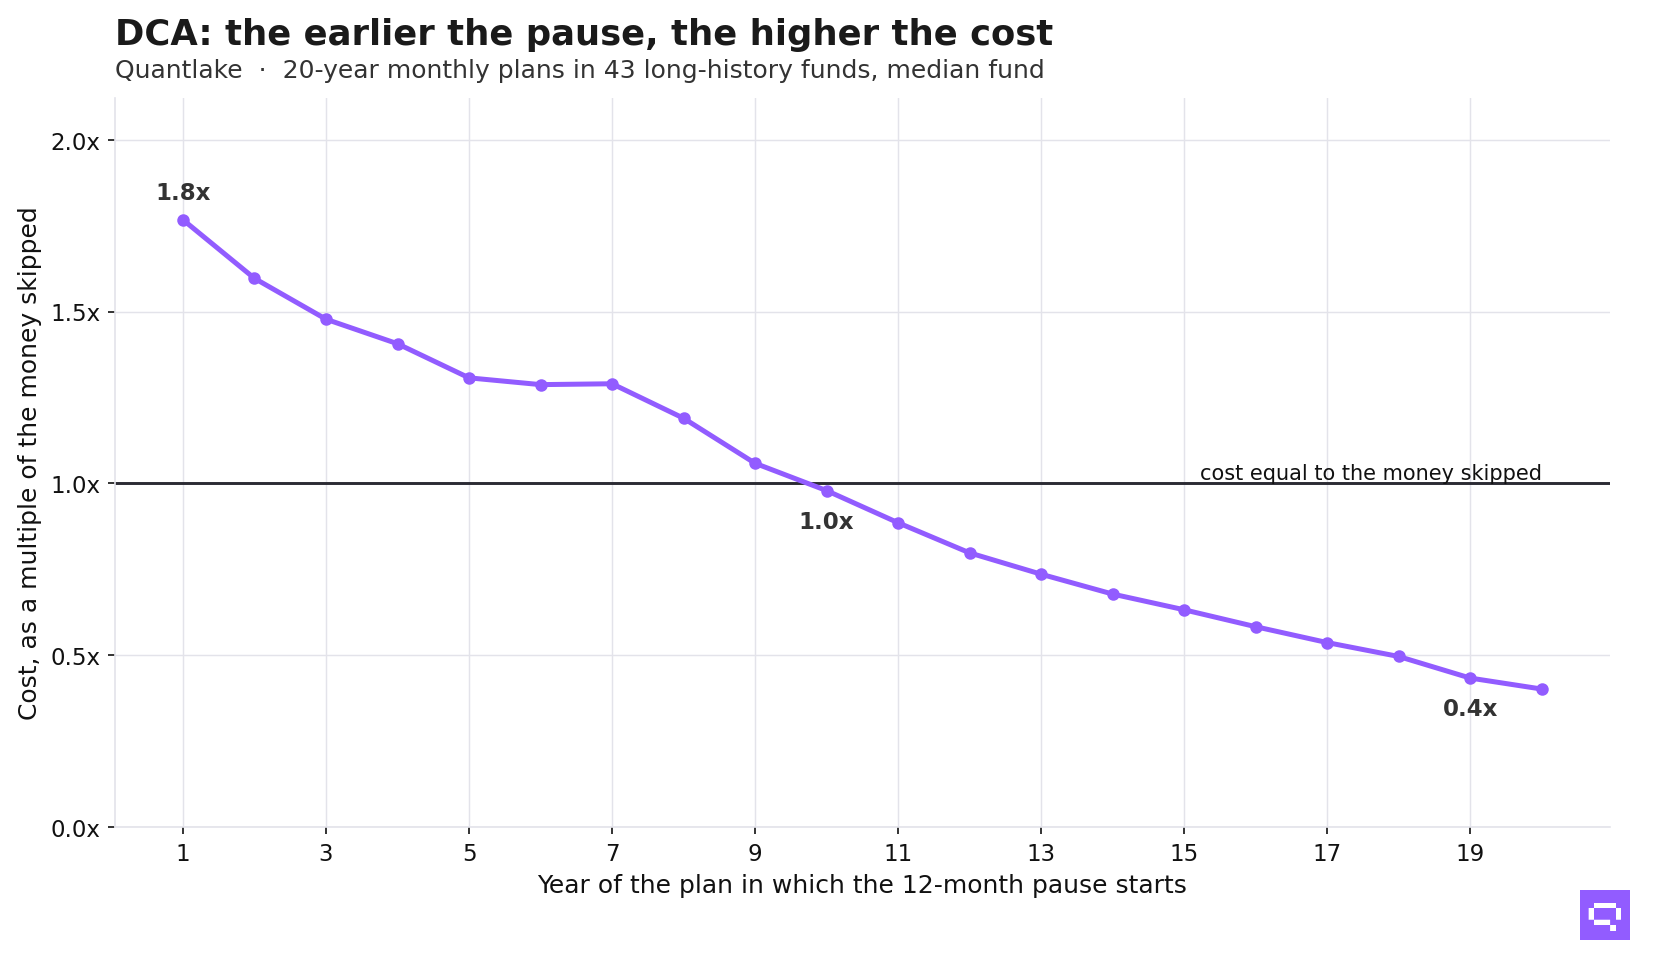
Pausing early. On twenty-year plans in 31 long-history funds (the 28 plus 3 duplicate share classes), a twelve-month pause in the first year cost the median fund 1.8 times the money skipped. In year ten the same pause cost 1.0 times; in year nineteen, 0.4 times.
Stopping in the fall and restarting at the old high. Stopping purchases once the fund was 20%, 30% or 40% below its high, and restarting only when the price regained that high, ended 2.4% to 2.8% of final wealth behind stopping for as long on random dates, averaged across ETFs on five-year plans. The rule skips the lowest prices of the fall by construction, and much of its cost is time out of the market.
Both reactions cost most when they are most tempting: early in a plan, and deep in a fall. That is the shape of the problem. Why a fall makes an investor pause or stop, and why the same fall makes spreading a sum feel safer than investing it, is the subject of Why Investors Choose Dollar-Cost Averaging; the figures above are what those two decisions cost in this record.
What the model portfolios lived through
Quantlake's model-portfolio tracker follows three monthly plans of $1,000, each a fixed mix of ETFs, backtested and updated once a month. Buffett-Inspired, 90% S&P 500 and 10% short-term Treasuries, started in January 2003 and was 4.8 years old at the October 2007 high. Its index fell 50.1% to March 2009; the statement fell 37.7%, the market took $40,517, 41 months of payments, and the plan was last below the money paid in on 6 July 2010.
Bogle-Inspired, started in January 2010, 80% US shares and 20% long-term Treasuries, was ten years old in March 2020. Its index fell 27.2%; the statement fell 26.9%. The market took $66,060, 66 months of payments, and the statement was back above its pre-fall value by 14 July 2020, with new payments adding to the recovery.
In 2022, twelve years in, its index fell 25.3% and the market took $92,073, 92 months of payments; the statement took until 19 July 2023 to regain its pre-fall value. Swensen-Inspired lost $70,379 in the same fall.
The two cases are the table at the top of this page in real allocations. A plan not yet five years old kept a quarter of its index's fall off the statement; a plan ten years old kept almost none of it.
Method and limits
- Universe. The Quantlake ETF Universe: 90 US-listed ETFs, priced from 1993 or their launch. 58 are equity funds, US and international, broad, sector, country, factor and dividend (SPY, QQQ, VTI, IWM, EFA, VEA, VWO among them); 12 hold Treasury, TIPS, mortgage, municipal or aggregate bonds (AGG, IEF, TLT, TIP); 7 hold corporate, high-yield, emerging-market or preferred debt (LQD, HYG, EMB); 5 are commodity funds (CPER, DBA, GLD, PDBC, SLV); 3 real estate, 3 multi-asset and 2 alternatives. All but 3 (DBMF, FTLS, JEPI) track an index. Beside them, 28 US mutual funds priced from 1979, 25 of them Vanguard funds. The methodology page lists every fund, the selection rules and what was left out.
- Falls of 10% or more from a fund's high, peak to trough, with a plan started 1 to 20 years before the high.
- Plans of $1,000 in one fund on the first trading day of each month, bought at the open for ETFs and at the day's net asset value for mutual funds; dividends reinvested through adjusted prices.
- Falls overlap across funds: 461 of the 621 ETF falls bottomed inside one of 15 market-wide episodes since the end of 1998, so the episodes are the honest sample size.
- Every fund here exists today; funds that closed are missing.
- The falls since 1871 use R. J. Shiller's monthly S&P Composite data (shillerdata.com), January 1871 to June 2026, where his dividend column ends and so the series does: each month's price is the average of its daily closes, one twelfth of the annual dividend is reinvested each month, and no fund fee applies.
- Taxes are not modelled. Taxes on dividends and on sales are left out of every figure. Depending on the account and the country, they can change the final outcome.
Frequently asked questions
Related
- Does dollar-cost averaging work? A study on ETFs and funds
- What if you invested $1,000 a month in an ETF portfolio?
- Lump sum vs dollar-cost averaging: a study on ETFs and funds
- Quantlake studies: the ETFs and funds tested, and the method
- Why investors choose dollar-cost averaging
- Quantlake model portfolios: Classic and Smart
- Compound interest calculator with volatility, inflation and fees