.png)

Portfolio Drift: How Far a 60/40 Moves Without Rebalancing
A 60/40 portfolio that is never rebalanced does not stay a 60/40 portfolio. Its equity share rises with every good year for stocks, and its risk rises with it. What the drift costs, and what pulling it back costs, on the S&P 500 ETF SPY and Aggregate Bonds AGG since 2003.
What is portfolio drift?
Portfolio drift is the gap that opens between the allocation an investor chose and the allocation they actually hold. Nothing has to be traded for it to happen. When one asset compounds faster than another, its share of the portfolio grows on its own, and the mix moves with it.
A 60/40 portfolio is the standard illustration. Take the two funds this page measures: the S&P 500 ETF SPY for the equity side, and Aggregate Bonds AGG for the bond side. Start at 60% SPY and 40% AGG, leave the account alone through a long equity bull market, and the SPY share climbs well past 60%. Nothing was bought. The equity holding simply grew faster than the bond holding, and the mix moved with it. The portfolio still holds the same units of each fund. It no longer holds the same risk.
A 60/40 that has drifted to 75/25 carries 15 points of equity drift.
Drift is directional, not random. It accumulates toward whichever asset has performed best, which means a portfolio drifts into risk precisely after the period when risk paid, and drifts out of it after the period when it did not.
What rebalancing does, and what it does not do
Rebalancing sells part of what has grown and buys what has lagged, returning the portfolio to its target weights. It is a risk-control mechanism. It is frequently sold as a return-enhancing one, and the historical record does not support that claim.
The distinction sets the right expectation. An investor who rebalances expecting higher returns will be disappointed in any period when the growth asset keeps winning, and may abandon the discipline at the worst moment. An investor who rebalances to hold their risk steady gets what they came for in every period.
Vanguard reached the same conclusion. Testing calendar and threshold rules on a 50/50 global portfolio back to 1926, they found no optimal frequency and no optimal threshold. Risk-adjusted returns were not meaningfully different whether the portfolio was rebalanced monthly, quarterly or annually. Their 2022 study, Rational Rebalancing, frames the choice as a trade-off between tracking the target and paying to do so, not a search for the frequency that earns most.
AQR frames the same trade from the other side, and the framing explains where the return difference comes from. Rebalancing is an active contrarian position measured against a buy-and-hold benchmark: it systematically sells whatever has been winning. Ilmanen and Maloney found that because asset prices tend to trend, less frequent rebalancing and wider tolerance bands have historically been favoured, since they let a trend run between trades.
The figures below carry the same signature. The portfolio that never rebalanced earned the most. Among the rules that did trade, the widest band earned the most and the most frequent calendar rule earned the least. The ordering in between is noisy, and the risk-adjusted differences stay small, so this is a tilt rather than a rule. It does mean the return given up by rebalancing is not a random cost. It is the price of holding a contrarian position in markets that trend.
Calendar, threshold or cash-flow
Three rules cover almost every practical approach, plus the option of doing nothing.
| Policy | Rule | Trade-off |
|---|---|---|
| Calendar | Rebalance on a fixed date: monthly, quarterly or annually. | Simple to run and to audit. Trades even when the portfolio has barely moved. |
| Threshold | Rebalance only when a weight drifts past a tolerance band, such as 5 points. | Trades far less often. Requires monitoring between dates. |
| Cash-flow | Steer new contributions or withdrawals toward the underweight asset. | Corrects drift without selling anything, so no capital gain is realised. |
| None | Hold the original units and let the weights go where they go. | No trading cost at all. The risk profile ends up wherever markets put it. |
Threshold rules trade least, because a portfolio that has not moved does not trigger one. Calendar rules trade on schedule whether or not there is anything to correct, which is the price of a policy that needs no monitoring. Cash-flow rebalancing is cheapest of all where contributions are large relative to the drift, since it corrects the mix without a sale.
Taxable accounts change the arithmetic
Every rebalancing trade in a taxable account is a potential realised gain. That argues for wider bands, for directing new money at the underweight asset before selling the overweight one, and for pairing rebalancing with loss harvesting when markets fall. In a tax-advantaged account none of that applies and the only real cost is the spread.
Why a schedule beats a judgment call
Rebalancing asks an investor to sell what has performed best and buy what has performed worst. That is the hardest trade to place voluntarily. It is hardest at exactly the moment it matters most: after a long run in one asset, when drift is widest and the winner has the strongest recent record.
A calendar rule removes the decision. The date decides, not the investor. There is no view to form on whether equities are expensive, no timing call to get right, and no moment where holding on quietly reframes itself as the smarter choice. The rule was set when nothing was at stake, which is the only time it can be set clearly.
Vanguard put a number on the difference. Their Advisor's Alpha framework values the mechanics of rebalancing at 14 basis points a year, and behavioural coaching, meaning the work of keeping an investor to the plan they chose, at 100 to 200. Between seven and fourteen times as much sits in following the rule as in the arithmetic of the rule itself.
The table below says the same thing from the other direction. The policies land within a few hundredths of each other on Sharpe, so what an investor does between the rebalancing dates matters more than which dates they picked.
What a schedule does not do is prevent losses. Every policy in the table below, including the ones that rebalanced most often, sat through a drawdown of more than 30%. A rule holds the allocation steady; it does not hold the market up.
How Quantlake rebalances
The Classic model portfolios rebalance quarterly. The Smart models review monthly and trade on threshold triggers rather than on the calendar. Quarterly is not chosen because it beats annual on risk-adjusted return. The evidence below shows it does not. It is chosen because it bounds how far the portfolios drift between reviews while keeping the trade count low.
What drift and rebalancing actually did
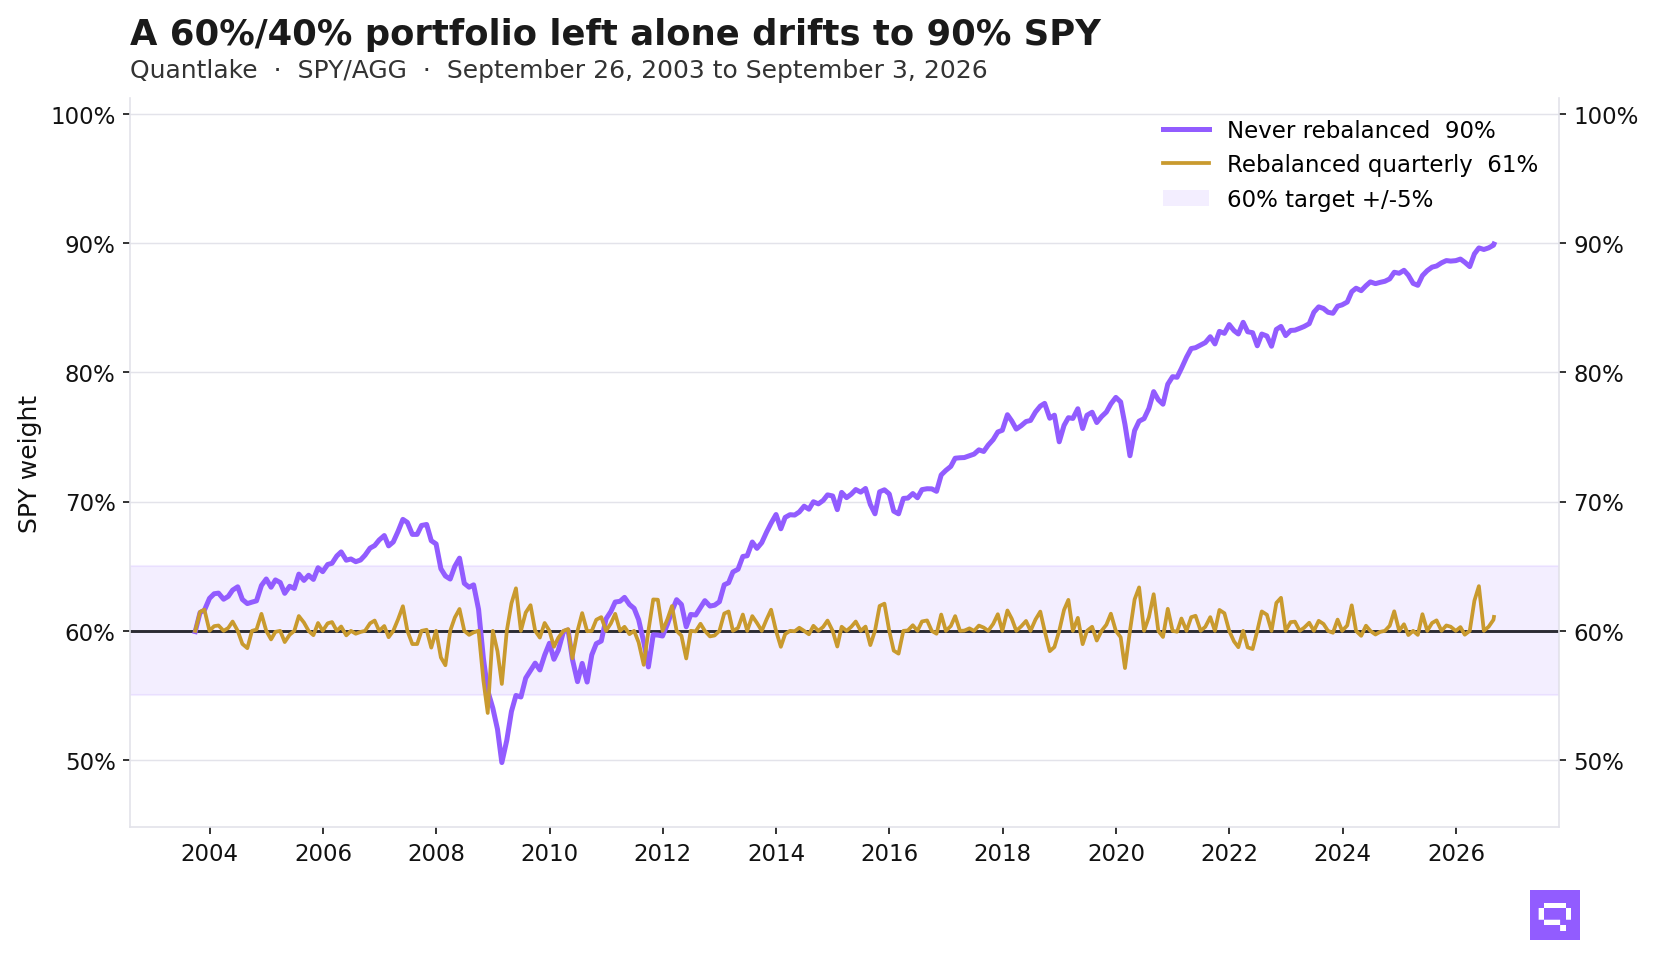
The figures below simulate a 60%/40% portfolio of S&P 500 SPY and Aggregate Bonds AGG from September 26, 2003, the first date both funds have prices, under five rebalancing policies. Returns are gross of costs and taxes, so the trade count sits next to them rather than folded into them. This block refreshes monthly.
| Policy | Return p.a. | Volatility | Sharpe | Max drawdown | Trades | End SPY | Days off target |
|---|---|---|---|---|---|---|---|
| Never (buy and hold) | 9.4% | 12.9% | 0.59 | −35.6% | 0 | 90% | 70% |
| Annual | 8.4% | 10.9% | 0.60 | −33.7% | 23 | 63% | 4% |
| Quarterly | 8.3% | 11.1% | 0.58 | −35.0% | 92 | 61% | 1% |
| Monthly | 8.2% | 11.2% | 0.57 | −35.8% | 276 | 60% | 0% |
| 5% drift band | 8.4% | 11.4% | 0.58 | −35.3% | 18 | 62% | 0% |
Left alone, the portfolio ended at 90% SPY against a 60% target, and spent 70% of its days outside the 5% band. It earned the highest raw return at 9.4%, and it carried the most risk at 12.9% volatility. Across all five policies the Sharpe ratios span 0.03, so on risk-adjusted terms the choice of rule made close to no difference. What separates them is the trade count: the 5% drift band rule held the allocation with 18 trades against 92 for quarterly.
How long before a 60/40 leaves its band
Every trading day in the sample was treated as a start date, and the portfolio left untouched until it drifted more than 5 points from target. The median start took 369 trading days, about 1.5 years. The middle half took between 214 and 575 days, and 31% of starts were out of band inside a single year.
The fastest took 6 trading days, from a start in October 2008. Drift is not a slow process that can be checked on once a decade. Its speed is set by how far the two assets separate, and in a dislocation they separate in weeks.
5,457 of 5,770 start dates drifted out of band before the data ended. The remaining 313 sit too close to the end of the sample to have breached yet and are excluded from the quantiles rather than counted as never breaching.
How wide the band should be
The same threshold rule at four tolerance widths. Tracking the target more tightly is not free, and the table shows where the price is paid.
| Band | Trades | Average drift | Worst drift | Return p.a. | Volatility | Sharpe |
|---|---|---|---|---|---|---|
| 1 pt | 285 | 0.4 points | 1.0 points | 8.4% | 11.3% | 0.58 |
| 3 pts | 38 | 1.1 points | 3.0 points | 8.3% | 11.3% | 0.57 |
| 5 pts | 18 | 2.1 points | 5.0 points | 8.4% | 11.4% | 0.58 |
| 10 pts | 5 | 4.6 points | 10.0 points | 8.6% | 11.7% | 0.57 |
A 1-point band held the allocation within 0.4 points of target on average and cost 285 trades. A 10-point band allowed 4.6 points of average drift and cost 5. That is 57 times the trading for 4.3 points of tighter tracking, while Sharpe across all four widths spans 0.01. The band width is a decision about turnover, not about return.
Drift over a 3-year horizon
The path above is a single 23-year history, and an investor holding for 3 years faces a distribution rather than that one path. Across all 5,015 overlapping 3-year windows in the sample, the median window ended +6.5 points from its 60% target. The tenth percentile ended -7.4 points and the ninetieth +10.3 points.
Drift runs both ways. The worst equity-side window ended +14.6 points, to March 2023, and the worst bond-side window -17.8 points, to March 2009. 77% of windows ended outside the 5-point band. Over a three-year holding period, ending on target is the exception.
September 26, 2003 to September 3, 2026. Sharpe uses a 1.8% risk-free rate (BIL T-bill proxy, annualised over the same window). Rebalancing is simulated without spreads, commissions or tax.
Frequently asked questions
Sources
- The Rebalancing Edge: Optimizing Target-Date Fund Rebalancing Through Threshold-Based StrategiesVanguard, 2024. Finds threshold rules preferable to calendar rules, measured on target-date funds rather than on multi-asset portfolios generally.
- Rational Rebalancing: An Analytical ApproachVanguard, 2022. Frames the frequency choice as a trade-off between tracking the target and paying to do so.
- Putting a Value on Your Value: Quantifying Vanguard Advisor's AlphaVanguard, July 2022. Sizes the components of advice: rebalancing at 14 basis points a year, behavioural coaching at 100 to 200.
- Portfolio Rebalancing, Part 1: Strategic Asset AllocationIlmanen and Maloney, AQR, 2015. Treats rebalancing as an active contrarian position, and finds that trending prices have favoured wider bands and less frequent trades.
- Portfolio Rebalancing: Common MisconceptionsAQR, 2017. What rebalancing does and does not do to expected return.
Related
- Quantlake model portfolios: Classic and Smart
- Compound interest calculator with volatility, inflation and fees
- Compare ETFs with the Sharpe ratio
- ETF trend metrics explained
- SPY vs RSP: cap-weight vs equal-weight
- QHI: the live market sentiment reading