RSP relative to SPY sits at the 3rd percentile of its full history and rose 1.6% this week.
The State Street SPDR S&P 500 ETF Trust (SPY) tracks the S&P 500, weighted by market value; the Invesco S&P 500 Equal Weight ETF (RSP) weights the same stocks equally and rebalances quarterly. This page compares their price, risk and relative strength, refreshed weekly.
Performance & Risk Snapshot
SPY vs RSP · adjusted close data, as of October 23, 2026
| Metric | SPY
Cap-weight S&P 500 | RSP
Equal-weight S&P 500 |
|---|
| Total return |
| 1 week | −0.4% | +1.1% |
| 1 month | −0.9% | +3.0% |
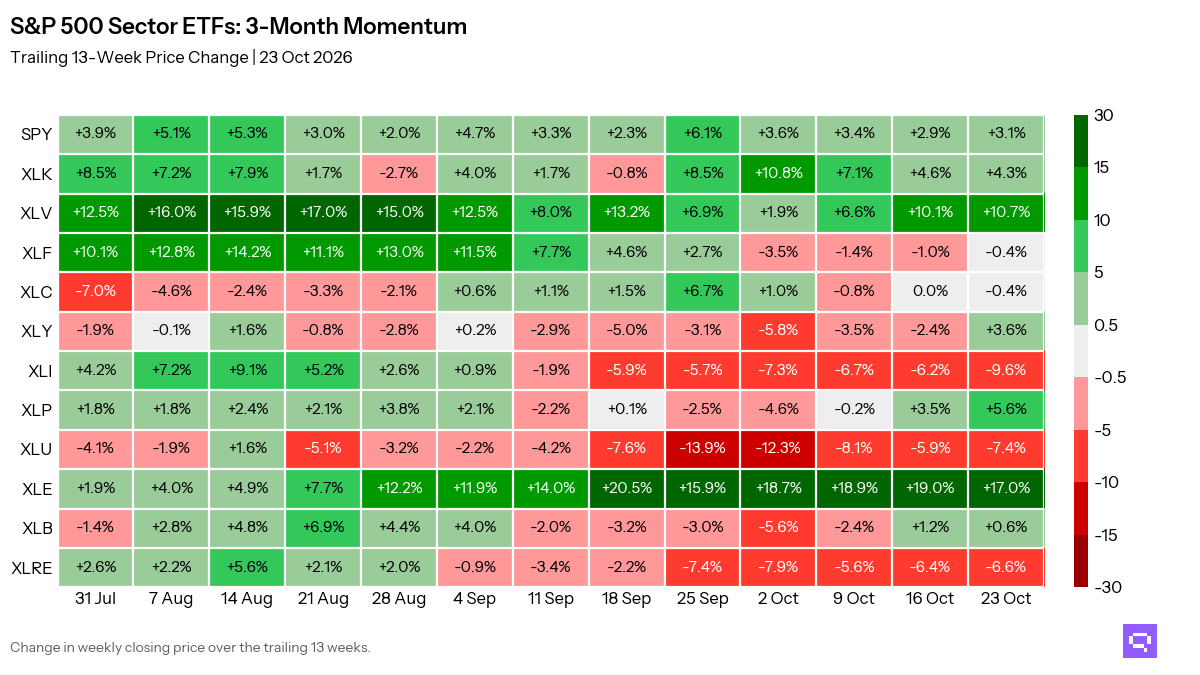
| 3 months | +3.1% | +1.0% |
| 1 year | +15.0% | +15.9% |
| 3 years annualized | +22.7% | +17.9% |
| 5 years annualized | +12.7% | +8.6% |
| Full period annualized, since 2003 | +11.4% | +11.2% |
| Risk (trailing 3Y) |
| Volatility annualized, Yang–Zhang | 15.1% | 13.8% |
| Max drawdown | −18.8% | −17.8% |
| Sharpe ratio | 1.19 | 0.97 |
| Sortino ratio | 1.77 | 1.43 |
| Calmar ratio | 1.21 | 1.01 |
| Trend (price vs its own SMA) |
| Price vs 10-month SMA regime | Above | Above |
| Price vs 13-week SMA intermediate | Below | Above |
| Cost & income |
| Expense ratio | 0.090% | 0.190% |
| Dividend yield TTM | 1.0% | 1.5% |
| Assets under management | $821B | $99B |
| Relationship |
| Correlation to each other daily, 3Y | 0.85 |
| RSP beta to SPY | 0.78 |
| Top-10 holdings weight | 39.3% | 2.7% |
How to read this. Over the trailing three years, SPY and RSP posted a correlation of 0.85. Three-year volatility ran at 15.1% for SPY and 13.8% for RSP.
This week
SPY fell 0.4% this week and RSP rose 1.1%. SPY trades above its regime trend and below its intermediate trend; RSP trades above its regime and intermediate trends. RSP relative to SPY rose 1.6%, crossed above its 13-week average and sits in the middle of its 12-month range. SPY is 2.5% below its October 6, 2026 high; RSP is 2.4% below its August 14, 2026 high.
RSP/SPY ratio
0.285
12-mo range 0.271 to 0.298
Ratio, 1 week
+1.6%
week over week
SPY from high
−2.5%
from its October 6, 2026 high
RSP from high
−2.4%
from its August 14, 2026 high
Concentration
SPY's top 10 holdings account for 39.3%. RSP's top 10 holdings account for 2.7%.
Top 10 Holdings & Weights
Share of fund assets in each of the ten largest positions
SPY top 10
Top 10 = 39.3% of the fund
NVDA8.29%
AAPL7.81%
MSFT6.10%
AMZN3.91%
GOOGL2.94%
META2.42%
GOOG2.41%
AVGO2.30%
TSLA1.60%
MU1.53%
RSP top 10
Top 10 = 2.7% of the fund
MRNA0.35%
PTC0.30%
P0.27%
ACN0.26%
MTD0.26%
RVTY0.26%
ILMN0.25%
ISRG0.25%
IT0.25%
HAS0.25%
Growth of $100
Since April 30, 2003, SPY compounded at 11.4% a year and RSP at 11.2% a year.
RSP / SPY Ratio
The ratio tracks RSP relative to SPY, and a rising line means RSP is leading SPY. The ratio sits below its 10-month moving average and above its 13-week moving average, and the near-term trend favors neither leg clearly, the two trend filters disagree.
Where the ratio stands
Full-range percentile
3rd
RSP/SPY full history
5-year percentile
14th
within last 5 years
Z-score
−2.22
vs full-history mean
The ratio stands at the 3rd percentile of its full history, the 14th percentile of the past five years, and a z-score of -2.22.
Rolling Correlation (RSP vs SPY)
The latest 126-day correlation between SPY and RSP is 0.68.
WEEKLY · 5Y · 126D WINDOW
Rolling Volatility
The latest 126-day volatility reading is 12.3% for SPY and 10.9% for RSP.
WEEKLY · 5Y · 126D WINDOW
Drawdown
Over the trailing three years, SPY posted a max drawdown of 18.8% and RSP 17.8%.
Time underwater
SPY longest underwater
52 mo
2007 to 2012
RSP longest underwater
44 mo
2007 to 2011
SPY spent 52 months (2007 to 2012) below its prior peak and RSP 44 months (2007 to 2011).
Rolling Beta
RSP's latest 126-day beta to SPY is 0.60.
WEEKLY · 5Y · 126D WINDOW
Upside / Downside Capture
Since April 30, 2003, RSP captured 105% of SPY's up months and 109% of its down months, with a capture ratio of 0.97.
Upside capture
105%
RSP vs SPY, up months, since Apr 2003
Downside capture
109%
RSP vs SPY, down months, since Apr 2003
Capture ratio
0.97
up ÷ down, since Apr 2003
Beyond the price
Cost. RSP's 0.190% expense ratio runs 0.100 points above SPY's 0.090%. Turnover. Equal weighting forces a periodic rebalance, so RSP carries higher turnover than SPY's near-static book. Volatility. Over the trailing three years RSP realized 13.8% against SPY's 15.1%.
The Bottom Line
SPY pairs higher long-run compounding with tighter ownership in its largest names. RSP spreads weight more evenly across the S&P 500 and its latest 126-day beta to SPY sits at 0.60.
Where these fit at Quantlake
Quantlake builds ETF exposure through Classic and Smart model portfolios, which hold the cap-weight core directly rather than an equal-weight tilt. Discover which model aligns with your Behavioral Risk profile.
Related
Definitions
Returns and risk
Total return: price change plus reinvested dividends, using adjusted-close prices.
Annualized volatility (Yang–Zhang): spread of returns scaled to one year; the Yang–Zhang estimator uses the open, high, low, and close of each bar, so it is more efficient than a close-to-close estimate.
Maximum drawdown: the largest peak-to-trough decline over the period.
Risk-adjusted ratios
Sharpe ratio: annualized return above T-bills (BIL) per unit of total volatility.
Sortino ratio: like Sharpe, but divides by the volatility of returns below the T-bill rate.
Calmar ratio: annualized return divided by the worst drawdown.
Trend and relationship
Trend filters (regime / intermediate / tactical): moving-average timeframes in the Quantlake taxonomy: the 10-month average marks the regime (long-term) trend, the 13-week the intermediate trend, and the 20-day the tactical trend. A price or ratio above its average is an uptrend on that horizon, below it a downtrend.
Correlation: co-movement between two return streams, from −1 to +1.
Beta: sensitivity to a reference; a beta of 2 moves about twice a given reference move.
Relative-strength ratio: one fund's price divided by another; a rising ratio means the numerator is outperforming.
Upside / downside capture: the share of the benchmark's up (down) moves the fund reproduces; a capture ratio above 1 means it kept more of the up moves than of the down moves.
Romain Gandon
CEO, Quantlake
Disclaimer: This article is for informational and educational purposes only and does not constitute investment advice. Past performance is not indicative of future results.


.png)