.png)

Can a Timing Rule Avoid the Worst Days? Three Tested
Three rules an investor could have followed from the first day, run on 90 ETFs and 27 mutual funds and set against holding on. The 200-day average cost the median ETF 1.8 points a year and cut its deepest fall from −48.9% to −25.8%.
Quantlake Time in the Market Study · 127 daily series · data through 31 August 2026 · updated 24 September 2026 · refreshed monthly
Two things to take away. The rules did protect against crashes: the 200-day average cut the median ETF's deepest fall from −48.9% to −25.8%. That protection cost 1.8 points of annual return.
Avoiding the worst days was not enough. The 200-day average sat out 90% of each ETF's ten worst days, and 100% of its ten best: it missed more of the rebounds than of the falls.
The ten-best-days chart compares staying invested with a portfolio nobody could have held. This paper asks the question that version cannot: take a rule an investor could have followed from day one, run it, and record the result.
Three rules:
- Out below the 200-day average, back above it.
- Out when 21-day volatility rises above 1.5 times its trailing median, back in below it.
- Out when price falls more than one year-volatility below its one-year high, back in within half that distance.
Each is measured against the only thing the investor could otherwise have done with that money: hold the asset and leave it alone. A rule that steps out is not invested the whole time, so the share of days it held the asset is reported beside every figure. Over the median ETF's history the 200-day average switched in and out 148 times and the volatility stop 16 times, each switch charged at a stated cost.
What this paper shows
- Return. Every rule cost the median ETF annual return: −1.8 points under the 200-day average, −0.7 points under the volatility filter and −1.2 points under the volatility stop.
- Risk-adjusted. The median change in Sharpe ratio was −0.03 under the 200-day average, +0.05 under the volatility filter and no change under the volatility stop. Every 95% interval includes zero, so none of those changes is measurable.
- The deepest fall. This is where the rules did something. It was shallower than holding on in 98% of ETFs under the 200-day average, 91% under the volatility filter and 92% under the volatility stop.
- The extreme days. The 200-day average missed 90% of each ETF's ten worst days and 100% of its ten best. That is the clustering measured in Missing the 10 Best Days, read from the other side.
What did each rule do?
Each figure is the median across instruments. The gap and the Sharpe change are each instrument's own difference from its own buy-and-hold, then the median, so they are not the difference between the medians beside them: the median rule and the median buy-and-hold are different instruments. The two 95% interval is what a block bootstrap over dates leaves around the median, which is narrower than the spread across the funds themselves: the Sharpe change ran −0.16 to +0.13 under the 200-day average and −0.14 to +0.14 under the volatility stop. A rule that holds the asset three days in four earns three days in four of its returns, and the days it sits out earn the bill rate; the gap column already carries that.
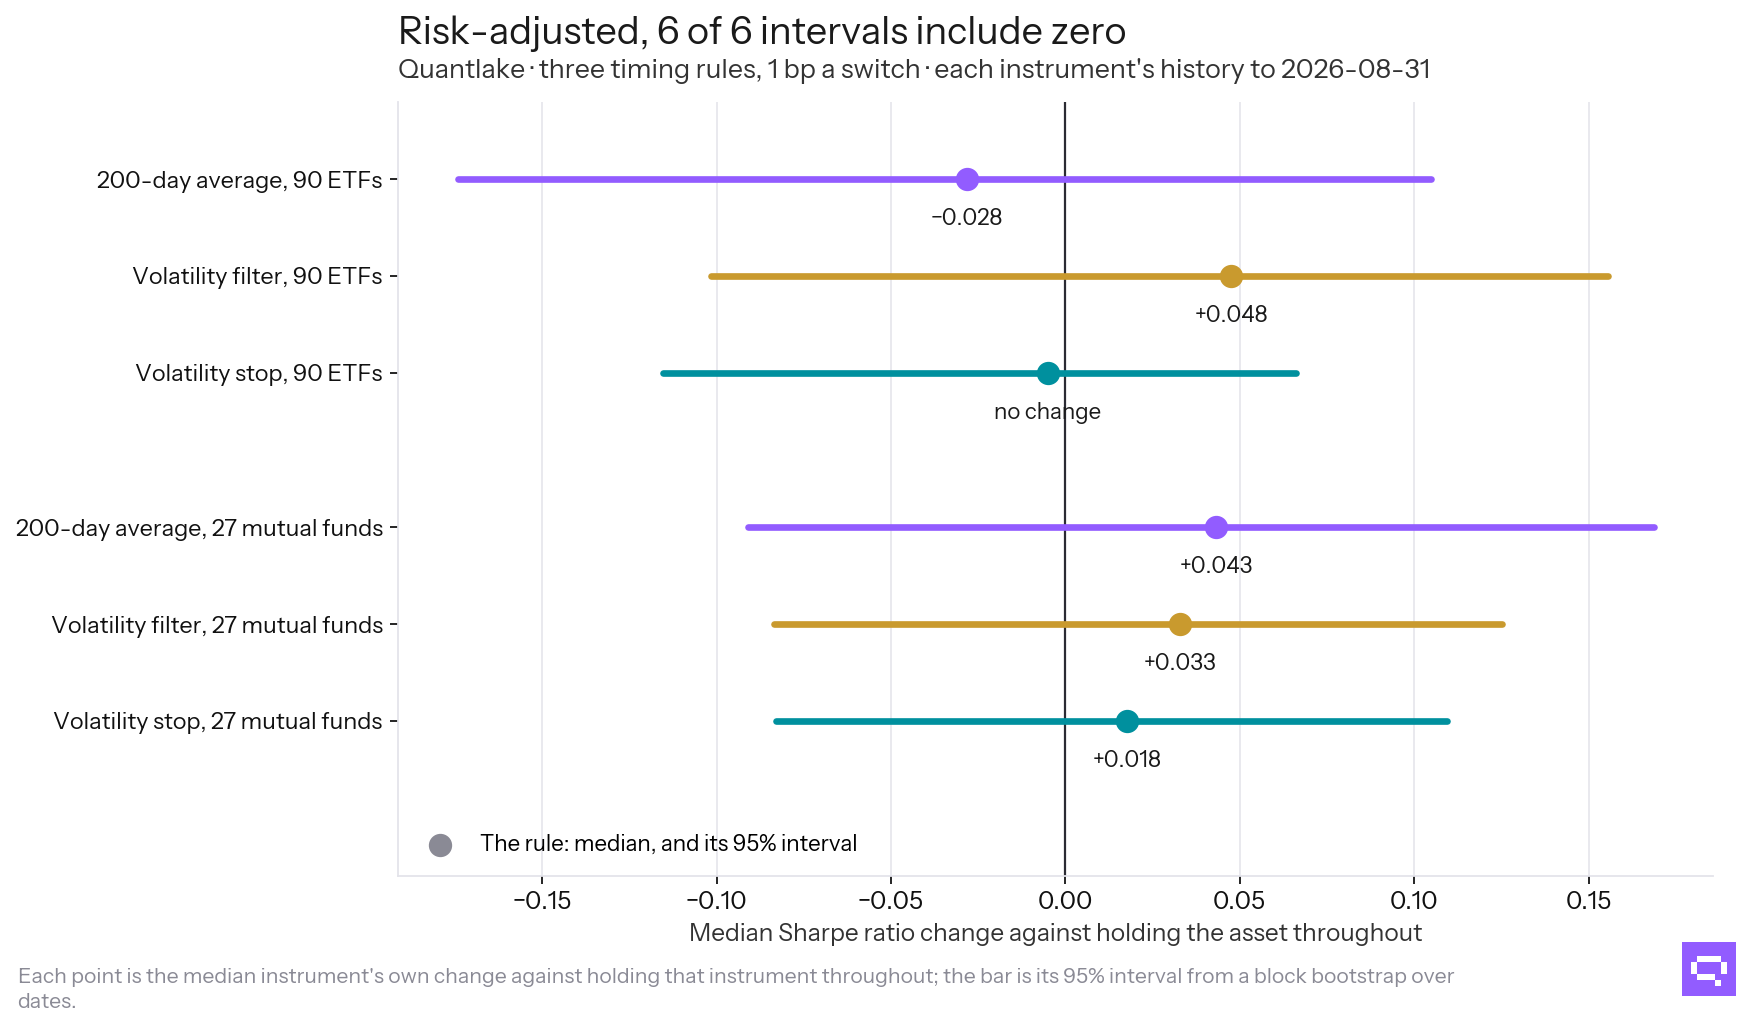
Each rule's median Sharpe change, with its 95% interval.
How did the timing compare with random days out?
Each rule's own days out were placed at random 500 times, keeping their number, and the annual return of each placement was compared with the rule's. A figure near 50% means the rule's timing returned about what the same number of days out, placed at random, did. The 200-day average beat 11% of its placements, the volatility filter 76% and the volatility stop 2%. Two of the three sat below the line: their days out were chosen worse than the same days out scattered at random.
What did the rules do to the deepest fall?
This is the one measure on which they delivered. Holding on, the median ETF's deepest fall was −48.9%. Under the 200-day average it was −25.8%, and the same rule returned 5.5% a year against 8.3% holding on. Each rule's lift, measured on each instrument against its own buy-and-hold and then taken at the median:
| Rule | Days invested | Deepest fall lifted by the rule | Return a year: rule / holding on |
|---|---|---|---|
| 200-day average | 74% | +18.4 pts | 5.5% / 8.3% |
| Volatility filter | 85% | +9.5 pts | 7.2% / 8.3% |
| Volatility stop | 85% | +12.5 pts | 6.4% / 8.3% |
Every rule bought that shallower fall with return. The exchange is the finding, and the table prices it: the rules took 19% to 38% off a fall of 48.9% for 0.7 to 1.8 points a year, on a position out of the market 15% to 26% of the time.
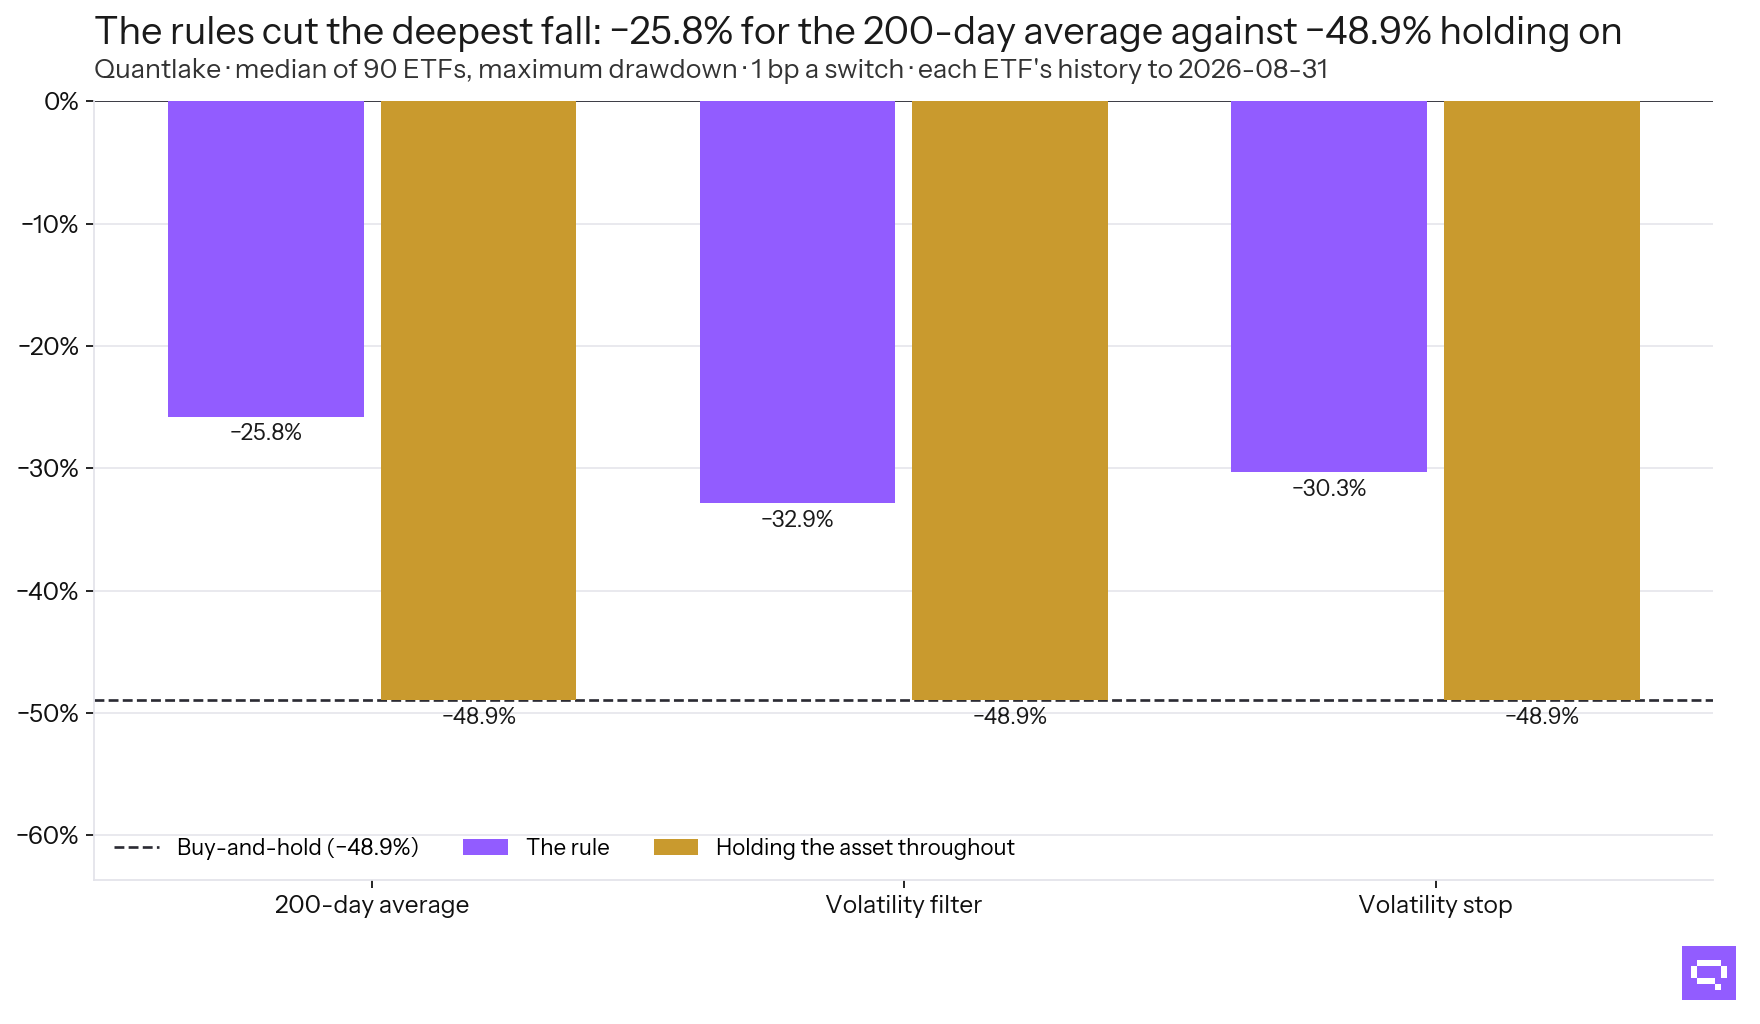
Each rule against buy-and-hold on the same instrument.
Did they avoid the worst days?
A timing rule pays only if it takes out more bad days than good, so that subtraction is the arithmetic that decides it. The 200-day average sat out 90% of each ETF's ten worst days and 100% of its ten best, which leaves it 10% further out of the best days than the worst. Read on the outer 1% of days rather than ten, the gap is 8% the same way. The two sets of days sit in the same weeks, so a rule that steps out of one steps out of the other. That is the clustering measured in Missing the 10 Best Days, arriving from the opposite direction.
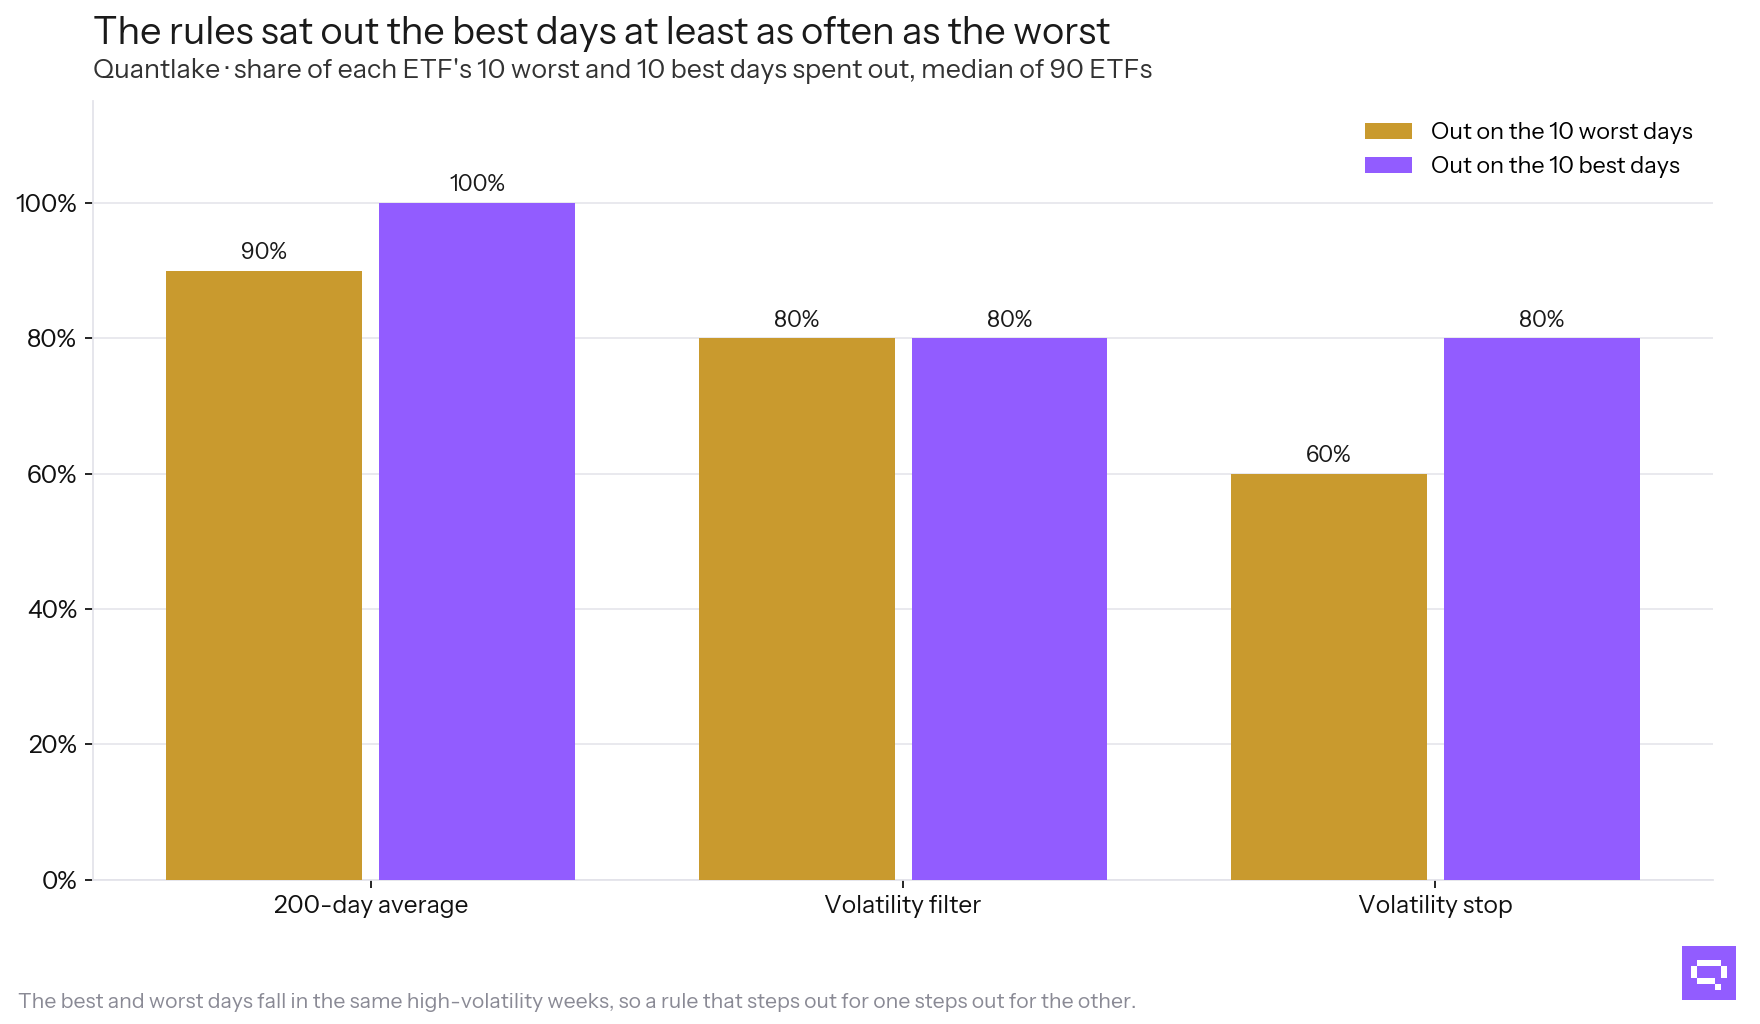
Median across 90 ETFs.
How much do trading costs matter?
Enough to decide the trend rule. The 200-day average returns 5.5% a year at 1 basis point a switch and 3.7% at a retail 25 basis points, on a median of 148 switches. The volatility stop switches 16 times and barely moves with cost.
The break-even runs the other way for the volatility filter: risk-adjusted it is ahead of holding on at no switching cost and crosses zero at 13 basis points a switch. Any conclusion about these rules holds only at a stated cost, which is why every figure here names one.
How a trade is filled. A signal read at the close of day t is executed at the open of day t+1 for an ETF and at the close of day t+1 for a fund or an index, which is how a fund order fills. Costs are 1 basis point a switch as the base case, with 5 and 25 also reported. Taxes are not modelled.
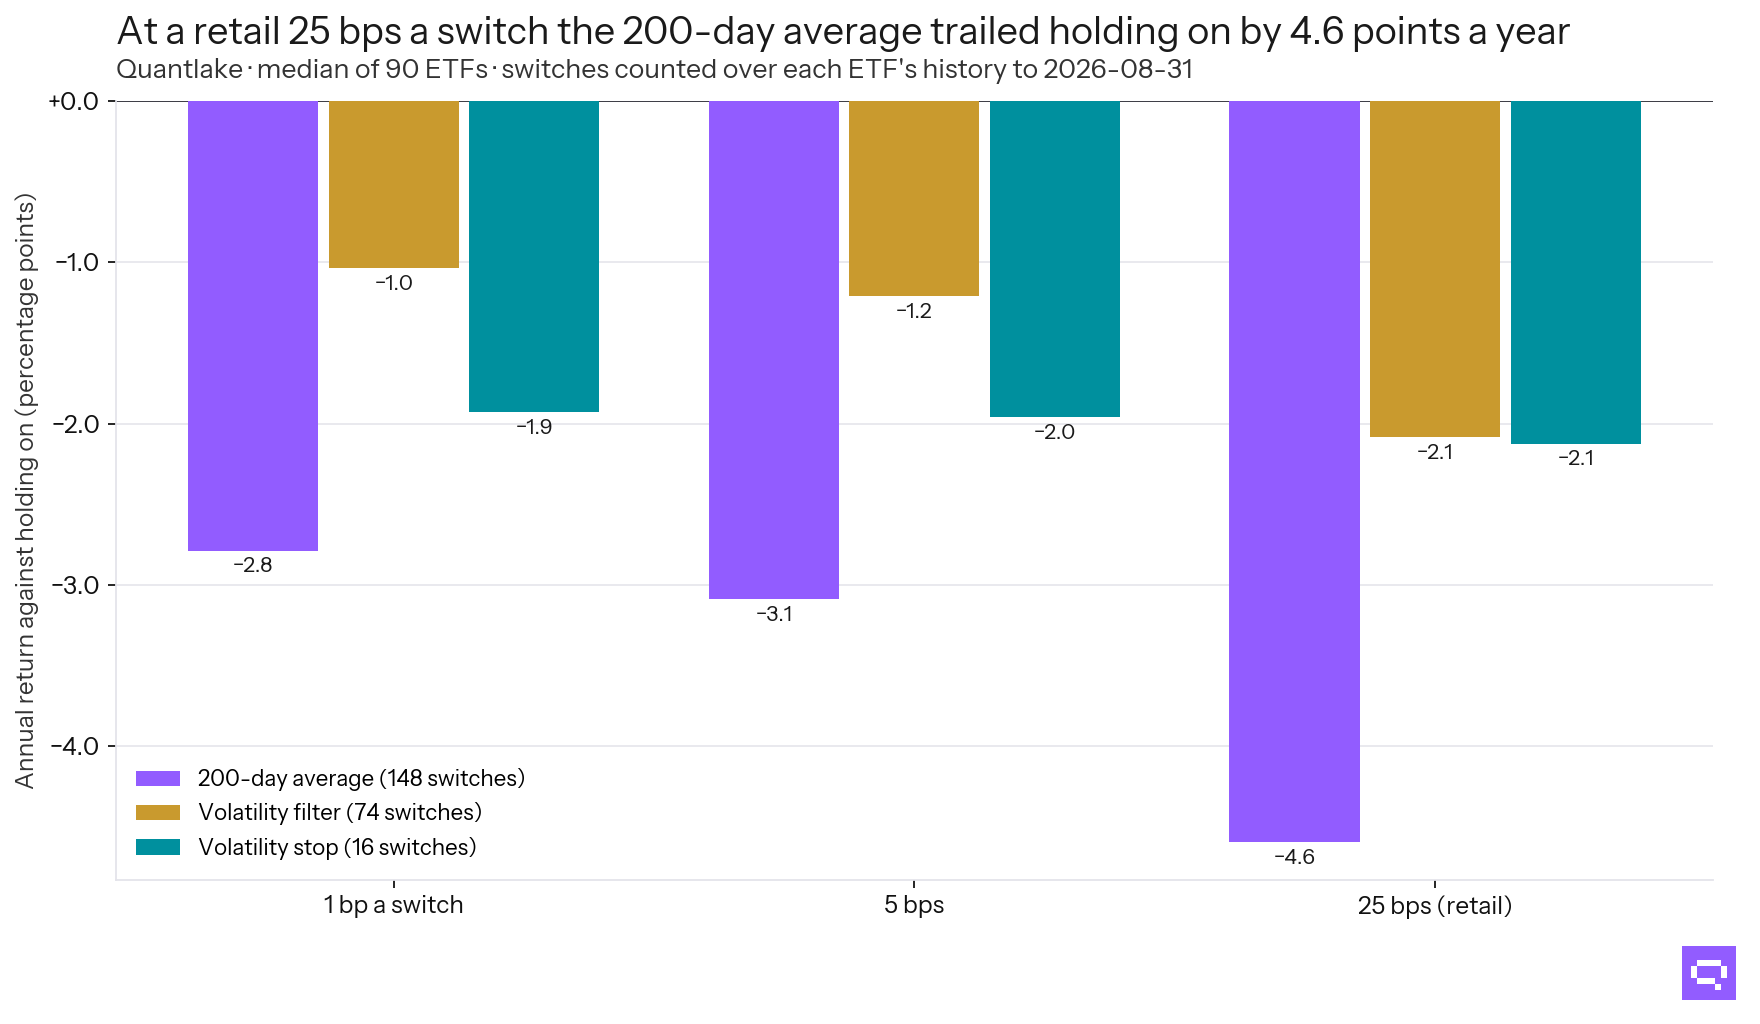
Median across 90 ETFs.
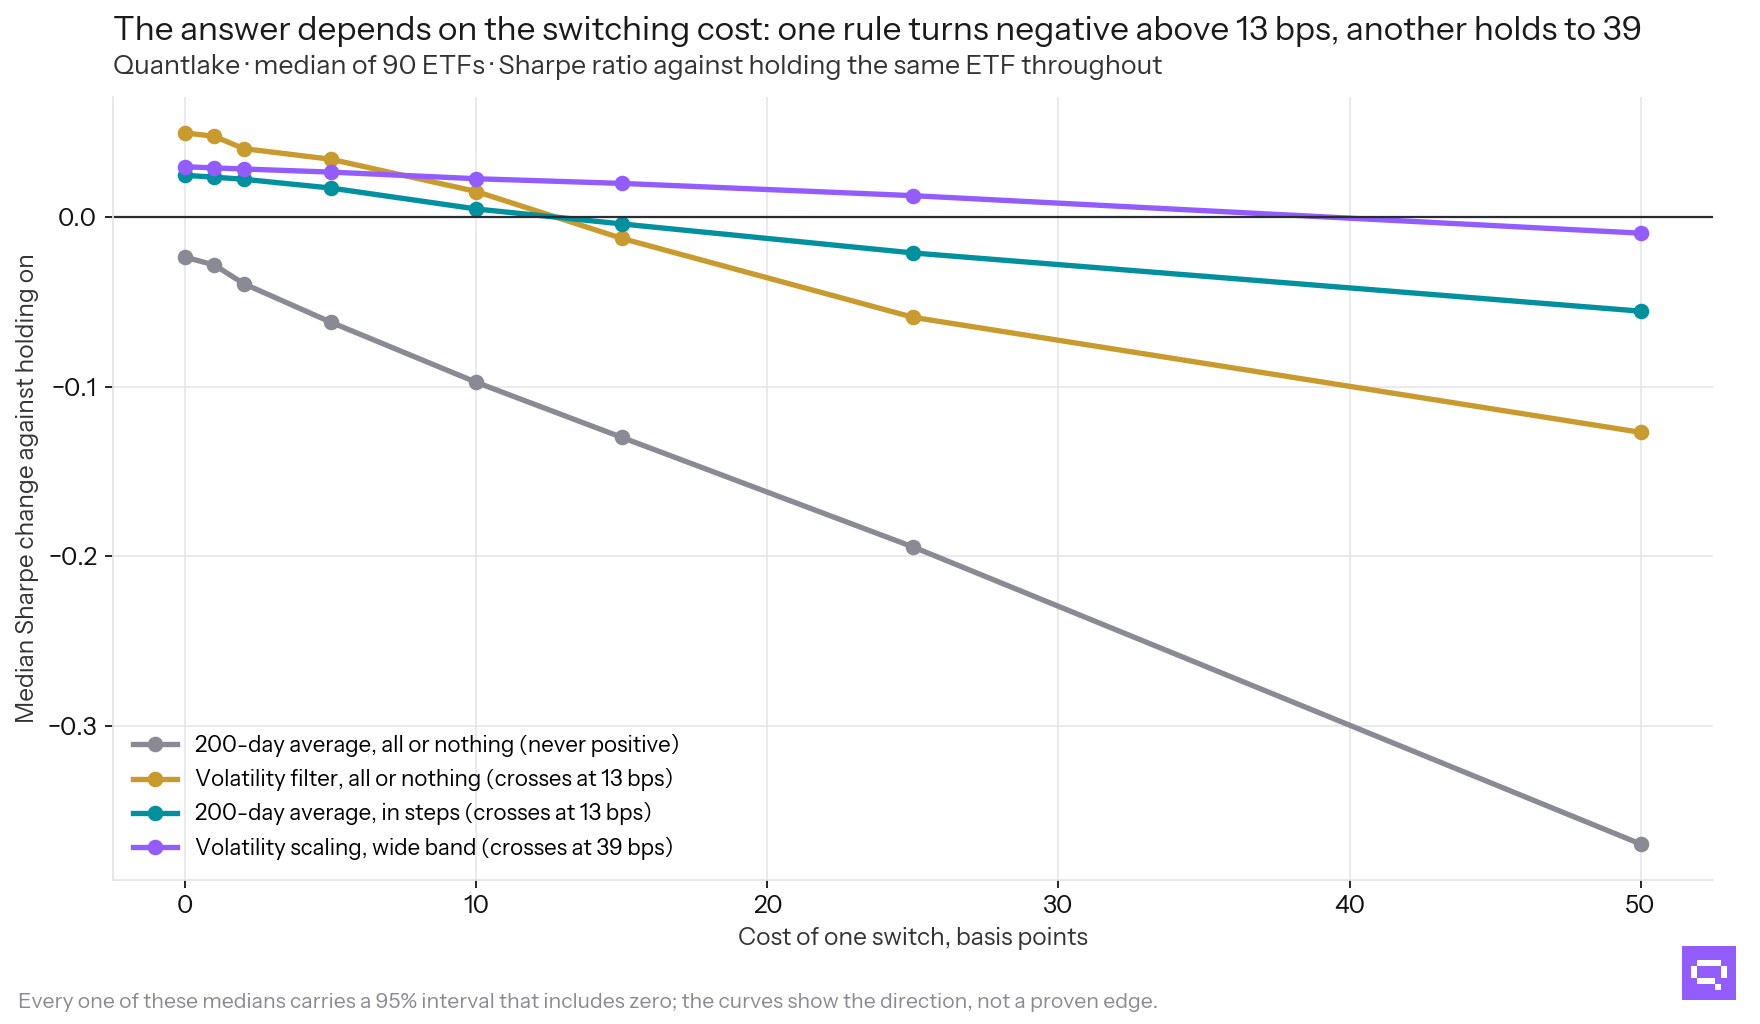
Median across 90 ETFs, at eight switching costs.
Did it depend on which crisis?
Yes, and no rule was ahead in every fall. The volatility filter gained 19% over holding on for the median ETF through 2007-11 to 2010-11 and lost 6% through 2000-01 to 2003-11. A rule built for one fall met a different one next time.
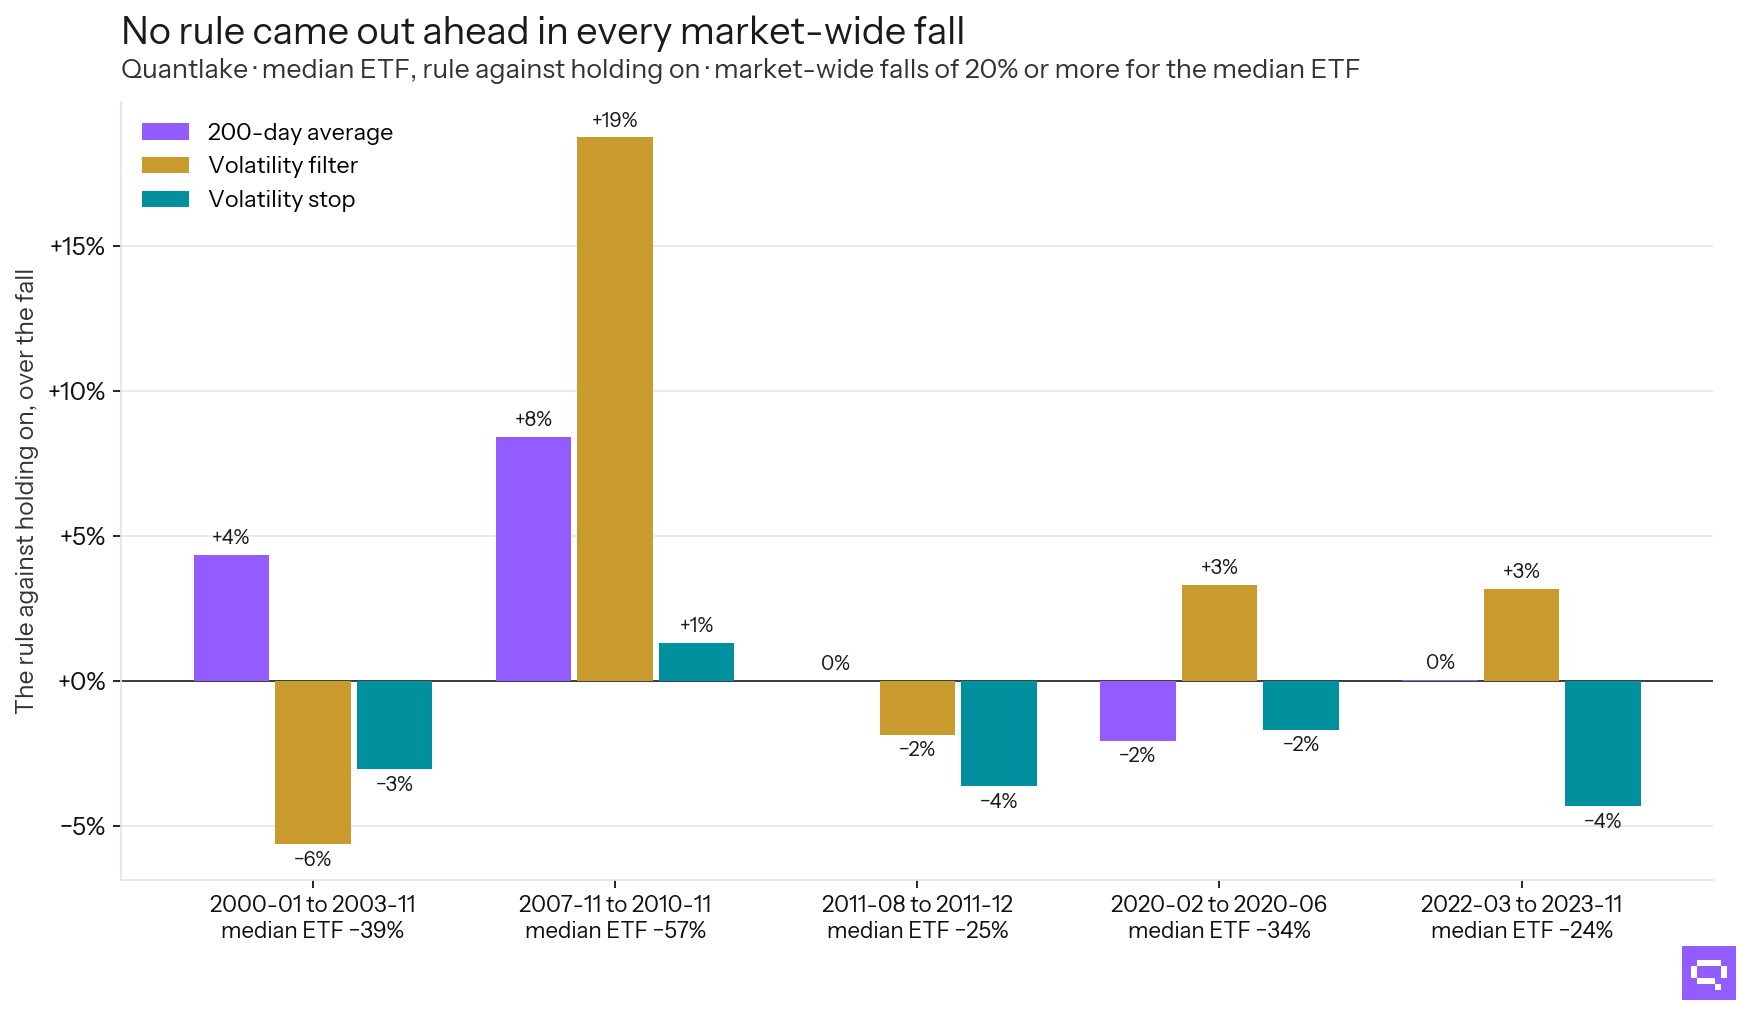
Median ETF, rule against holding on.
Did stepping out gradually work better than switching off?
The same signals were run again holding 80%, then 60%, then 40% while the condition lasts, returning to 100% when it clears; and as a rule that scales the weight with how far volatility sits above its own median. Between those moves, nothing is rebalanced. The holding drifts with the market until the next step.
Their medians sit close to zero with intervals that include it: the 200-day average in steps at +0.024 (−0.054 to +0.062) against holding on, volatility scaling with a wide band at +0.029 (−0.038 to +0.079). The scaling rule with a wide band trades least of all the variants, and its edge over holding on crosses zero at 39 basis points a switch.
Holding part of the position does not separate the two tails either. The scaling rule held 64% of its position on each ETF's ten worst days and 64% on its ten best, against 90% on an average day. The same question asked of a panic sale, where cutting a fifth at a time cost 66% less than selling the lot, is in What Selling in a Crash and Waiting to Buy Back Cost.
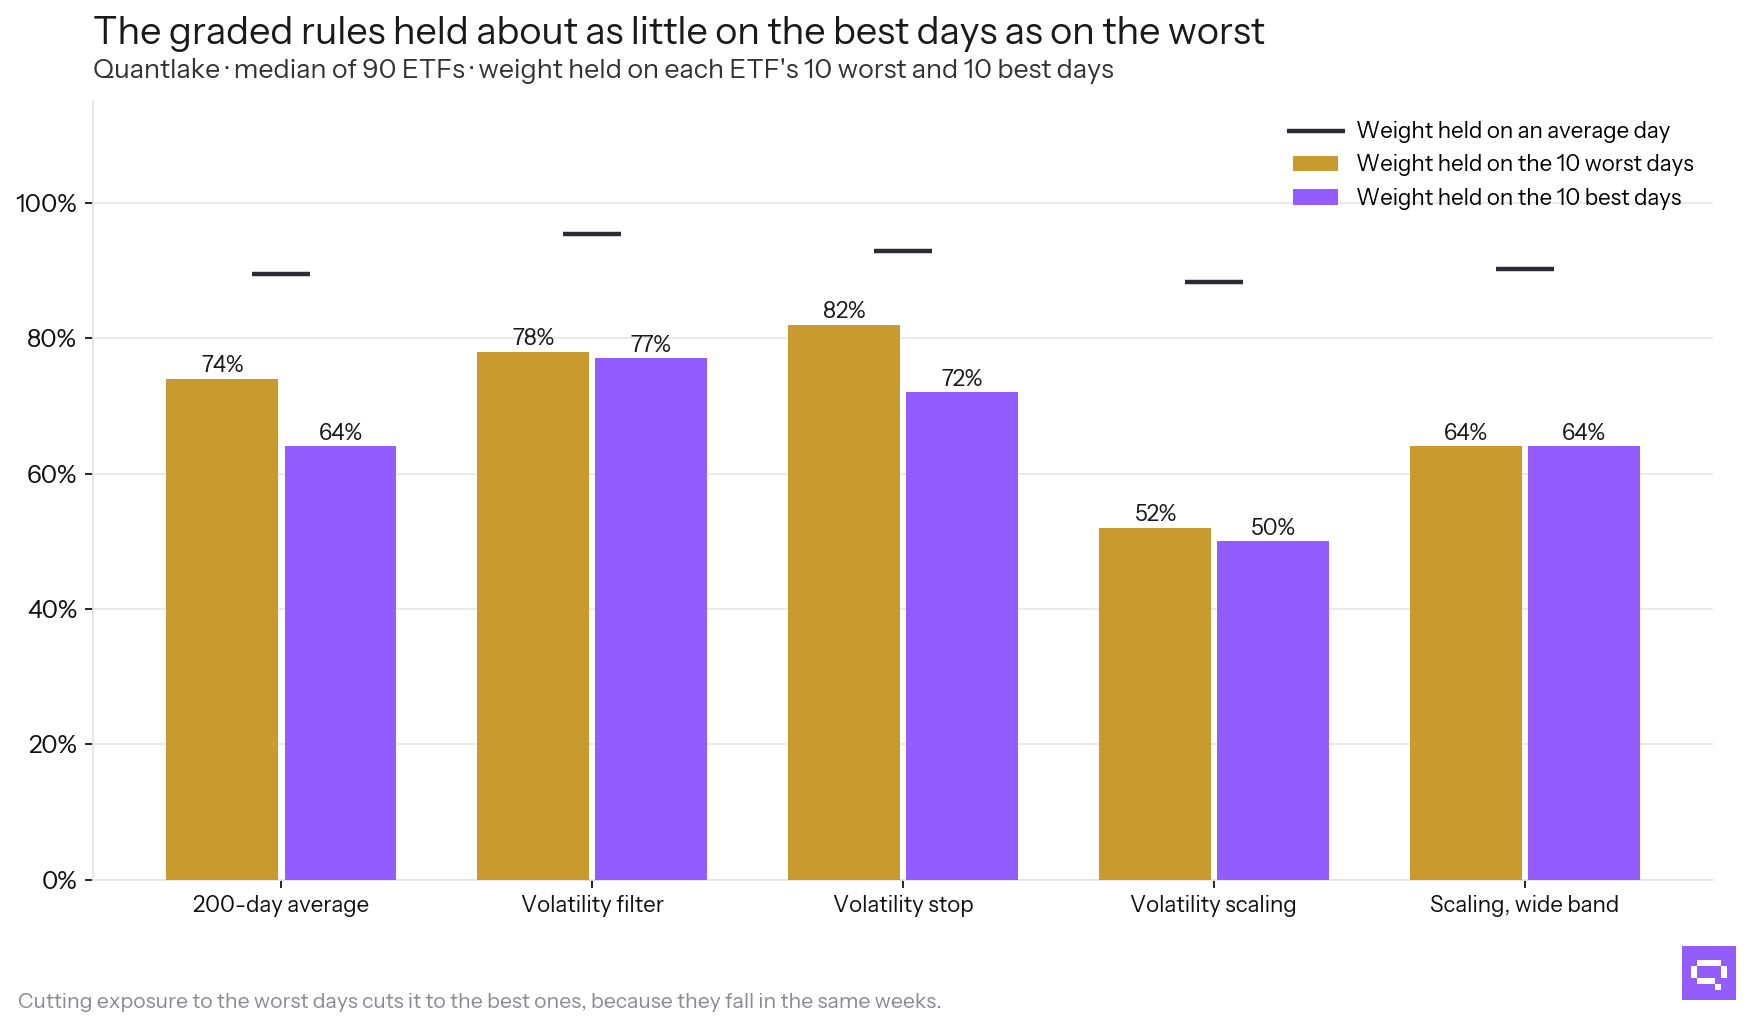
Median of 90 ETFs, for each graded rule.
One place the trend rule did help
On the S&P 500 with dividends since 1929, the 200-day average returned 10.10% a year against 9.88% holding on, on 72% of days invested. That history includes 1929 to 1932. Across the 90 ETFs, which begin in 1993 or later, the same rule fell short.
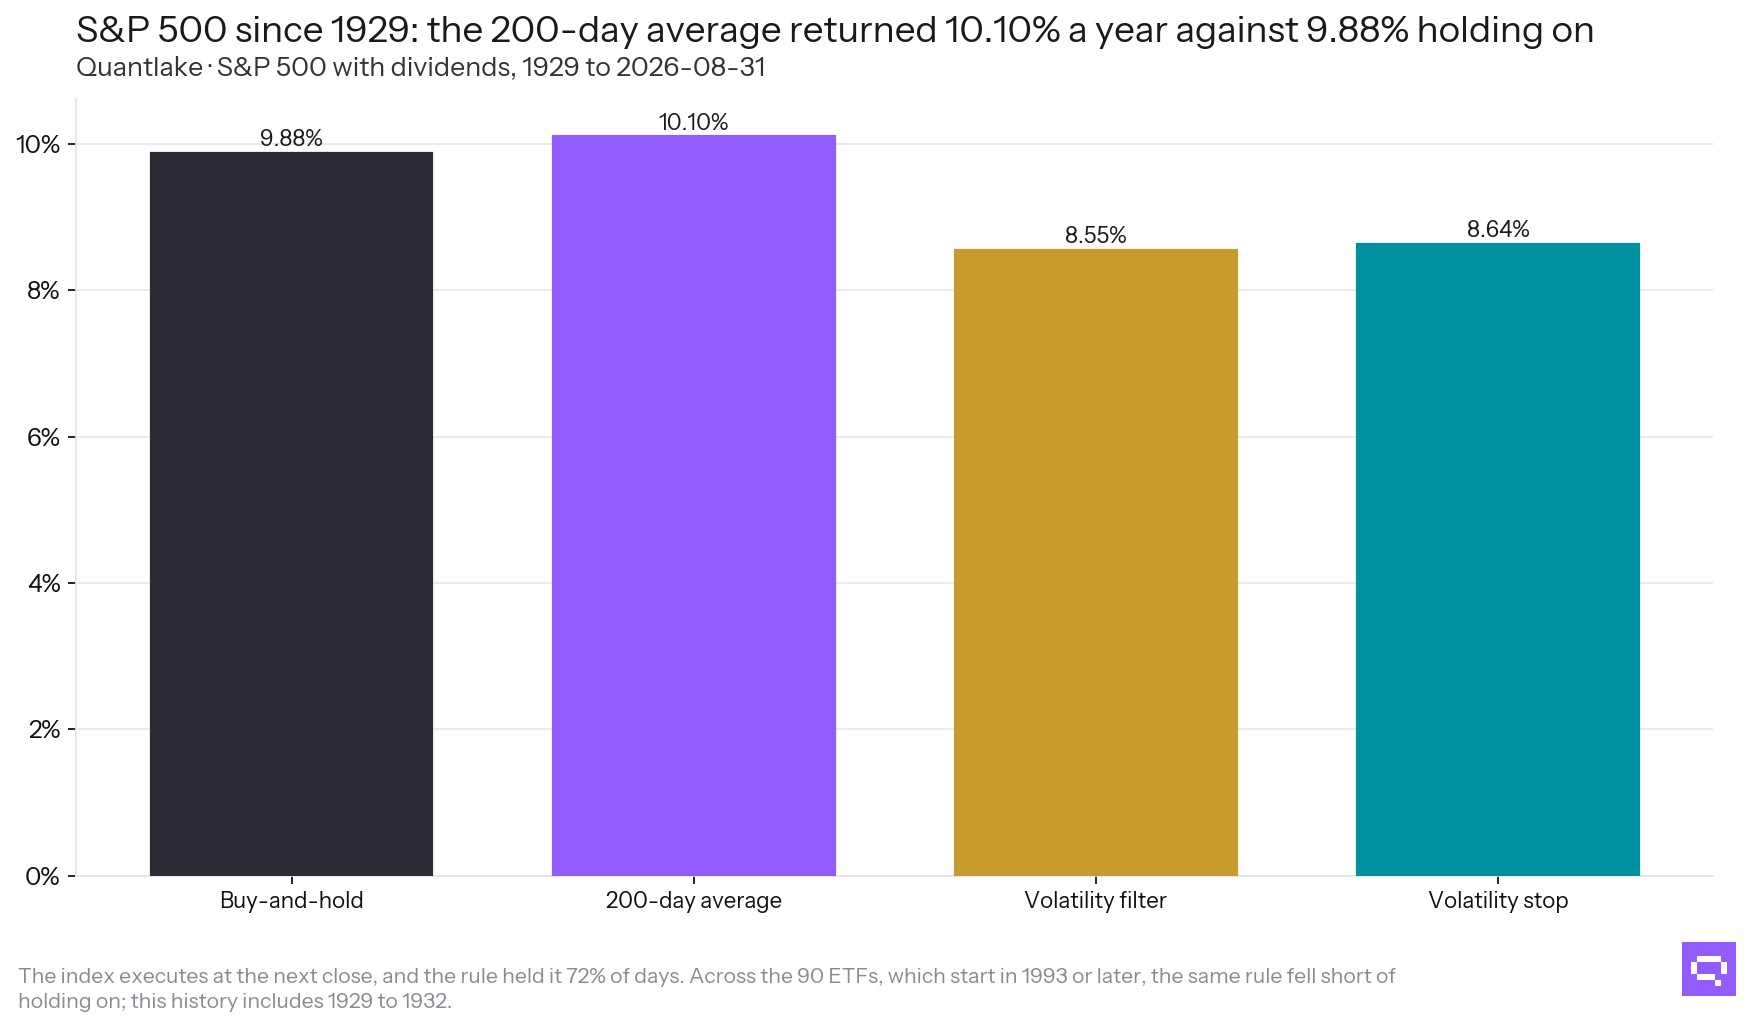
Dividends reinvested; the index trades at the next close.
Could the two kinds of day be told apart beforehand?
The rules are one way to ask. A more direct way reads the state of the prior evening, which is all anyone has: volatility over 21 and 63 sessions, the fall from the year's high, the distance from the 200-day average, and the last month's return.
For each day in an instrument's outer 1%, the 20 nearest days by that state, excluding the five days around it so that one episode cannot match itself: around a best day, 8.6% of its neighbours were themselves best days and 6.7% were worst days. Around a worst day, 4.1% were worst days and 5.5% were best days. Every one of those sits above the 1% an ordinary day would give, so the state marks that a large move is near. The pairs sit close together, so it does not mark which way.
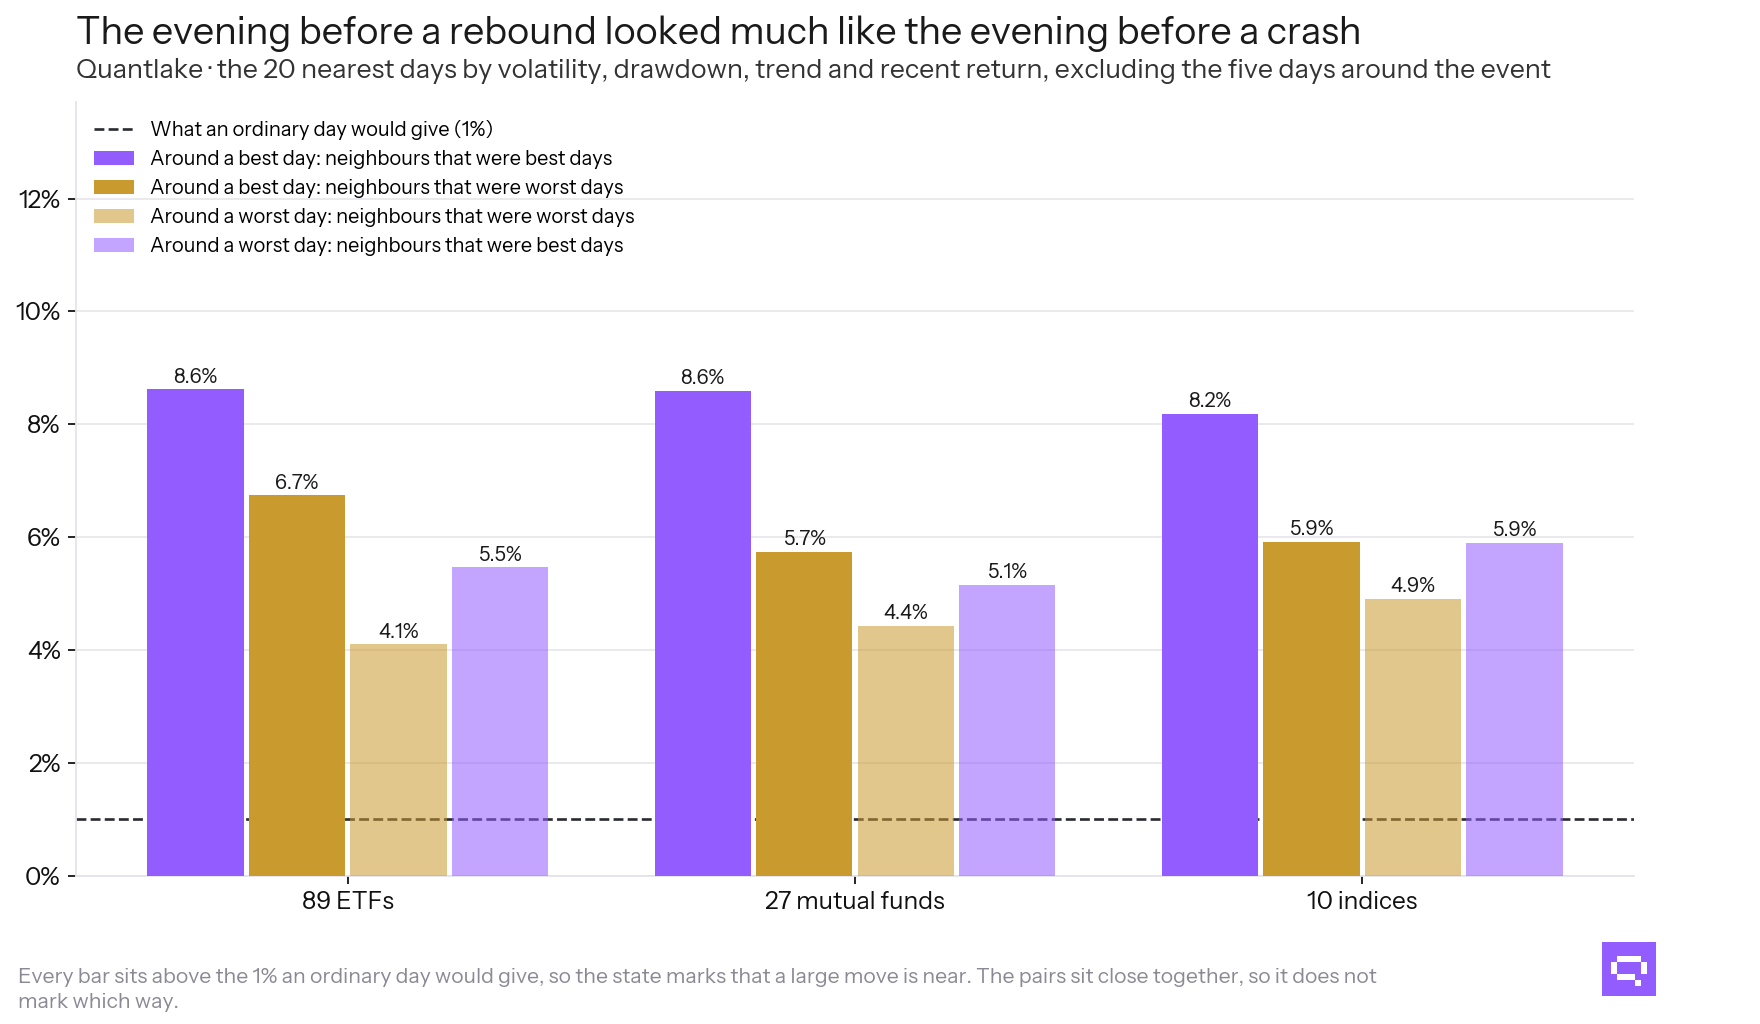
The 20 nearest days to each tail day, by the state of the evening before.
The same question, asked of a model. Logistic regression on that state, fitted only on days before the one it judges, refitted each year, scored on days it had never seen. Whether tomorrow is a large move of either sign: area under the ROC curve 0.852, against 0.501 with the labels shuffled. Because a large move is rare, the precision-recall figure is the fairer one: 0.248 against a base rate of 2.1%, and the highest-scoring 1% of days held 47% true large moves.
On which way that move would go, given that it came: 0.561 against 0.486 shuffled, and a precision-recall figure of 0.525 against a base rate of 48.3%.
Everything the model reads is scaled by an average and a deviation taken from earlier days only; scaling by the whole sample would hand it a number out of its own future. The model is a diagnostic of what was knowable. It is not a model to trade.
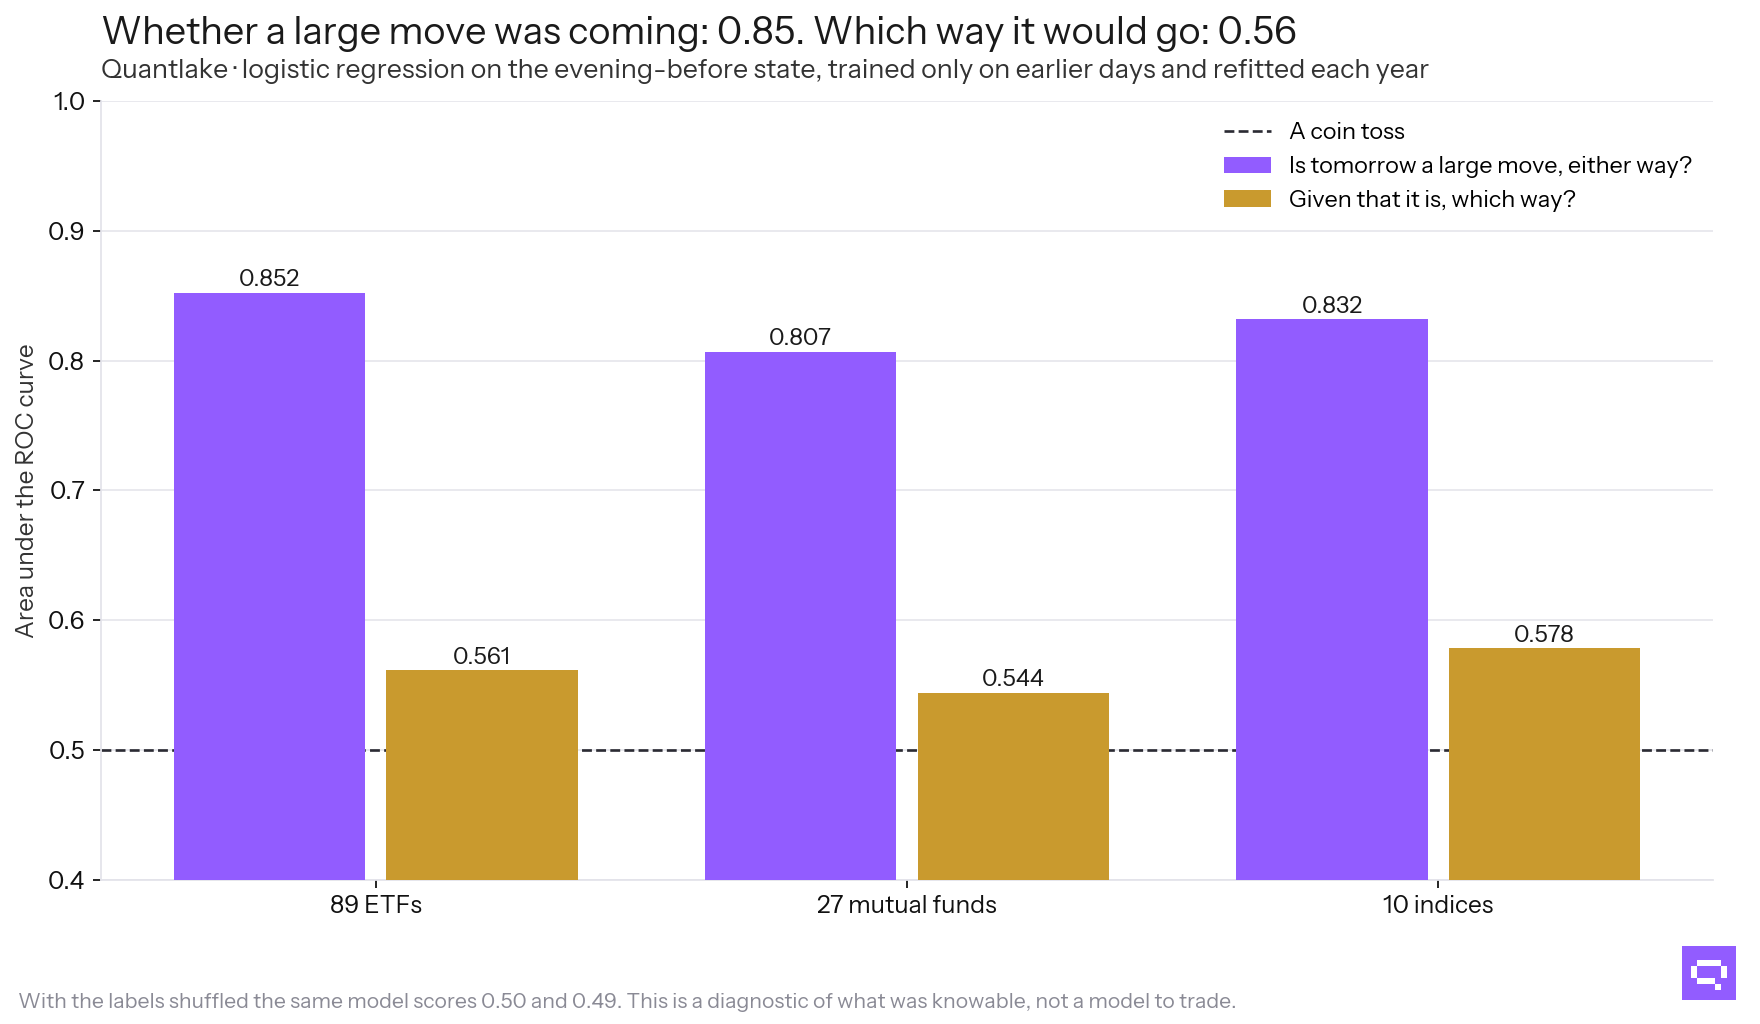
Trained on the past only, refitted each year, scored on days it had never seen.
The size of a move, read continuously. Dividing each day's move by the volatility known the evening before, the next year's return is flat across the middle of the range, between 9.9% and 10.2%, and lifts at both ends: 23.0% below −6 standard deviations.
A regression says the same. The result that survives depends on how the data are counted. Instruments share their shocks, so the same crisis enters the panel ninety times, and each day's next year overlaps the next day's in all but one session. The errors below allow for both.
| Reading | log volatility | a tail day | the tail was the fall |
|---|---|---|---|
| 327,341 instrument-days | +0.097 (t +2.9) | +0.045 (t +1.0) | +0.010 (t +0.8) |
| each date's average removed | +0.039 (t +1.9) | +0.012 (t +1.4) | +0.010 (t +1.4) |
| 6,941 dates, one each | +0.075 (t +1.4) | +0.003 (t +0.1) | +0.049 (t +1.7) |
Log volatility posts a t-statistic of +2.9 across instrument-days, +1.9 with each date's average removed, and +1.4 once each date counts once. The day's outlier effect posts +1.0 across instrument-days and +0.1 once each date counts once. The outlier direction, fall versus rise, posts +0.8, +1.4, and +1.7.
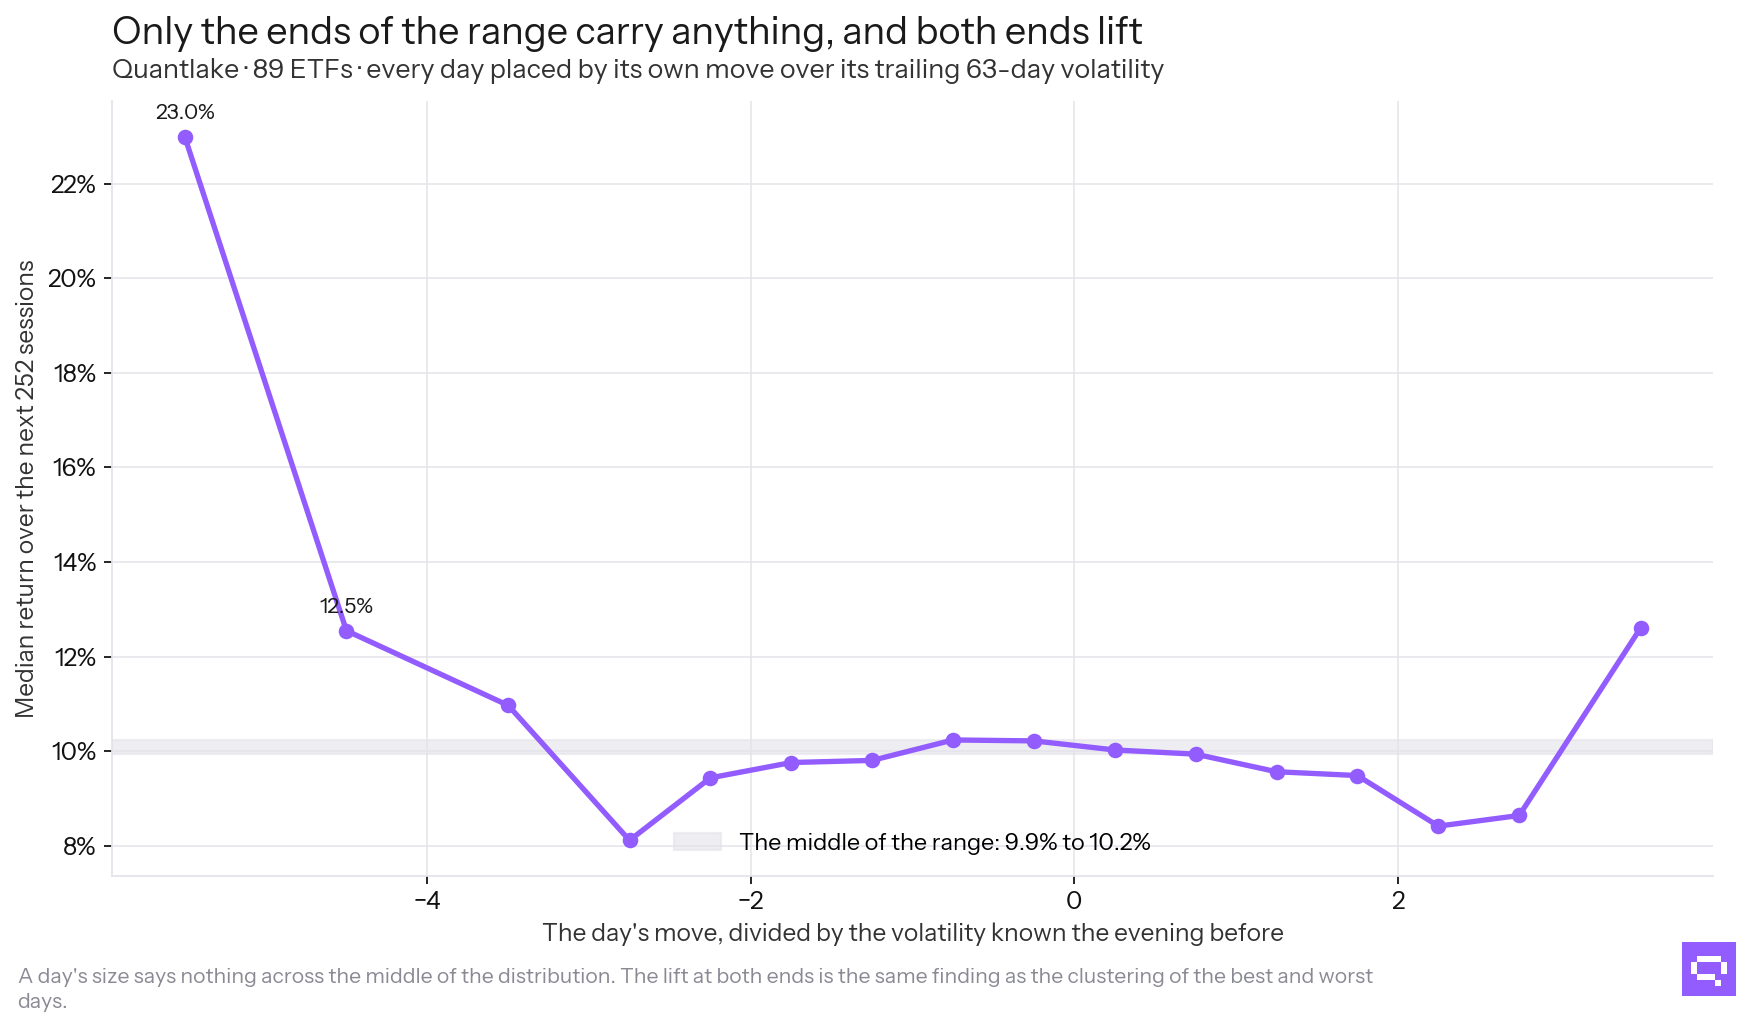
89 ETFs, each day over its own trailing volatility.
Volatility identified that a large move was near. The model scored 0.85 on whether one was coming. Directional information was limited: 0.56 on direction, against 0.49 with the labels shuffled.
Every instrument
Each rule's figures for every instrument tested, beside the instrument's own buy-and-hold. In each rule's column, the first figure is its annual return against holding that instrument, in percentage points, and the second is its deepest fall, so each rule's cell reads gap then fall. Each table is sorted by asset class and then by name.
ETFs
| Ticker | Instrument | Buy-and-hold | 200-day average | Volatility filter | Volatility stop |
|---|---|---|---|---|---|
| FTLS | First Trust Long/Short Equity ETF | 8.9% · −21% | −3.6 · −19% | −1.2 · −13% | −1.3 · −15% |
| DBMF | iMGP DBi Managed Futures Strategy ETF | 9.8% · −20% | −2.5 · −15% | −2.9 · −20% | +0.4 · −18% |
| DBA | Invesco DB Agriculture Fund | −0.5% · −68% | +2.4 · −40% | +0.6 · −67% | +0.7 · −55% |
| PDBC | Invesco Optimum Yield Diversified Commodity Strategy No K-1 ETF | 10.4% · −41% | −2.8 · −36% | −0.9 · −25% | −2.9 · −36% |
| GLD | SPDR® Gold Shares | 10.7% · −46% | −2.6 · −33% | −1.0 · −35% | −3.5 · −46% |
| CPER | United States Copper Index Fund LP | 3.3% · −51% | −3.3 · −43% | −2.1 · −53% | −0.6 · −40% |
| SLV | iShares Silver Trust | 8.2% · −76% | −2.6 · −60% | +1.3 · −69% | −0.9 · −69% |
| JNK | SPDR® Bloomberg High Yield Bond ETF | 6.8% · −23% | −1.6 · −14% | −1.0 · −17% | −1.4 · −14% |
| VCIT | Vanguard Intermediate-Term Corporate Bond Index Fund ETF Shares | 3.9% · −21% | −0.3 · −7% | +0.2 · −15% | +0.5 · −7% |
| VCSH | Vanguard Short-Term Corporate Bond Index Fund ETF Shares | 2.7% · −13% | −0.1 · −5% | +0.1 · −3% | +0.3 · −4% |
| EMB | iShares J.P. Morgan USD Emerging Markets Bond ETF | 5.8% · −29% | −0.6 · −11% | −1.7 · −26% | −0.3 · −17% |
| PFF | iShares Preferred and Income Securities ETF | 4.2% · −64% | +0.5 · −16% | −0.3 · −41% | +0.1 · −22% |
| HYG | iShares iBoxx $ High Yield Corporate Bond ETF | 5.1% · −33% | −0.9 · −15% | −0.5 · −14% | −0.2 · −13% |
| LQD | iShares iBoxx $ Investment Grade Corporate Bond ETF | 4.2% · −25% | −0.5 · −12% | −0.1 · −18% | −0.2 · −13% |
| XLC | Communication Services Select Sector SPDR® Fund | 13.1% · −47% | +2.0 · −24% | +2.2 · −31% | +1.7 · −19% |
| XLY | Consumer Discretionary Select Sector SPDR® Fund | 9.4% · −59% | −3.8 · −29% | −1.4 · −51% | −1.2 · −37% |
| XLP | Consumer Staples Select Sector SPDR® Fund | 7.5% · −36% | −4.8 · −27% | −2.7 · −47% | −1.6 · −23% |
| XLE | Energy Select Sector SPDR® Fund | 8.5% · −72% | −1.0 · −42% | 0.0 · −60% | −0.8 · −65% |
| XLF | Financial Select Sector SPDR® Fund | 6.5% · −83% | −1.7 · −36% | −2.4 · −69% | −0.1 · −50% |
| XLV | Health Care Select Sector SPDR® Fund | 8.1% · −39% | −5.7 · −46% | −1.4 · −33% | −4.3 · −47% |
| XLI | Industrial Select Sector SPDR® Fund | 9.1% · −62% | −1.8 · −28% | −2.4 · −57% | −3.7 · −45% |
| QQQ | Invesco QQQ Trust | 8.4% · −81% | −0.1 · −45% | +0.8 · −82% | −0.9 · −65% |
| RSP | Invesco S&P 500® Equal Weight ETF | 10.4% · −60% | −3.5 · −28% | +0.5 · −36% | −2.8 · −34% |
| JEPI | JPMorgan Equity Premium Income ETF | 8.0% · −14% | −4.9 · −16% | −2.3 · −13% | −3.4 · −20% |
| XLB | Materials Select Sector SPDR® Fund | 8.2% · −60% | −4.3 · −43% | −1.9 · −50% | −5.6 · −48% |
| DIA | SPDR Dow Jones Industrial Average ETF Trust | 8.8% · −52% | −4.5 · −45% | −2.0 · −50% | −2.4 · −39% |
| SPYG | SPDR® Portfolio S&P 500 Growth ETF | 10.5% · −51% | −1.1 · −25% | −0.9 · −47% | +0.1 · −30% |
| SPYV | SPDR® Portfolio S&P 500 Value ETF | 8.3% · −58% | −1.8 · −30% | +0.8 · −32% | −1.1 · −25% |
| MDYG | SPDR® S&P 400 Mid Cap Growth ETF | 9.7% · −59% | −1.9 · −28% | −1.1 · −45% | −1.9 · −29% |
| MDYV | SPDR® S&P 400 Mid Cap Value ETF | 8.1% · −61% | −2.6 · −32% | −2.3 · −51% | −2.3 · −31% |
| SLYG | SPDR® S&P 600 Small Cap Growth ETF | 9.1% · −60% | −2.3 · −34% | −0.5 · −52% | −1.3 · −32% |
| SLYV | SPDR® S&P 600 Small Cap Value ETF | 9.9% · −61% | −3.9 · −38% | +0.8 · −27% | −3.4 · −42% |
| SDY | SPDR® S&P Dividend ETF | 8.6% · −55% | −3.4 · −24% | −1.0 · −40% | −2.3 · −45% |
| SCHD | Schwab U.S. Dividend Equity ETF | 13.6% · −33% | −5.7 · −30% | −0.9 · −16% | −2.2 · −21% |
| SPY | State Street® SPDR® S&P 500® ETF Trust | 10.9% · −55% | −1.8 · −24% | −1.9 · −52% | −0.9 · −30% |
| XLK | Technology Select Sector SPDR® Fund | 8.8% · −82% | +0.6 · −49% | +1.0 · −79% | +2.4 · −39% |
| XLU | Utilities Select Sector SPDR® Fund | 7.9% · −52% | −3.0 · −30% | −1.3 · −43% | −1.2 · −40% |
| VIG | Vanguard Dividend Appreciation Index Fund ETF Shares | 10.0% · −47% | −4.1 · −22% | −0.9 · −38% | −1.9 · −26% |
| VEA | Vanguard FTSE Developed Markets Index Fund ETF Shares | 6.7% · −50% | −0.7 · −24% | +0.7 · −27% | −0.7 · −29% |
| VWO | Vanguard FTSE Emerging Markets Index Fund ETF Shares | 5.6% · −68% | −1.5 · −33% | −0.9 · −46% | −2.6 · −45% |
| VGK | Vanguard FTSE Europe Index Fund ETF Shares | 6.0% · −64% | −1.0 · −30% | −0.1 · −44% | −0.3 · −30% |
| VYM | Vanguard High Dividend Yield Index Fund ETF Shares | 9.7% · −55% | −2.6 · −23% | −1.2 · −30% | −0.7 · −25% |
| VO | Vanguard Mid-Cap Index Fund ETF Shares | 9.9% · −59% | −2.5 · −29% | +0.5 · −42% | −1.8 · −32% |
| VB | Vanguard Small-Cap Index Fund ETF Shares | 9.7% · −60% | −4.5 · −38% | +1.3 · −28% | −2.8 · −38% |
| VTI | Vanguard Total Stock Market Index Fund ETF Shares | 11.0% · −55% | −3.0 · −27% | +0.1 · −37% | −1.7 · −31% |
| VT | Vanguard Total World Stock Index Fund ETF Shares | 11.1% · −34% | −3.4 · −20% | −0.9 · −21% | −2.3 · −28% |
| FXI | iShares China Large-Cap ETF | 5.2% · −73% | −0.9 · −60% | −1.3 · −69% | −1.0 · −58% |
| IJR | iShares Core S&P Small-Cap ETF | 9.9% · −58% | −4.1 · −40% | −0.2 · −42% | −3.8 · −43% |
| IVLU | iShares Edge MSCI Intl Value Factor ETF | 10.4% · −42% | −0.7 · −20% | −1.7 · −22% | −1.9 · −35% |
| IDV | iShares International Select Dividend ETF | 7.3% · −59% | −0.7 · −26% | +2.0 · −32% | +1.1 · −28% |
| EWZ | iShares MSCI Brazil ETF | 9.6% · −77% | −2.0 · −54% | −4.5 · −78% | −8.4 · −83% |
| MCHI | iShares MSCI China ETF | 3.7% · −63% | −0.4 · −41% | −4.5 · −68% | +0.7 · −44% |
| EFA | iShares MSCI EAFE ETF | 8.3% · −61% | −0.4 · −24% | −0.3 · −45% | −1.1 · −26% |
| EFAV | iShares MSCI EAFE Min Vol Factor ETF | 7.1% · −28% | −1.6 · −14% | −2.4 · −25% | +0.2 · −13% |
| EEM | iShares MSCI Emerging Markets ETF | 8.4% · −66% | −1.6 · −37% | −3.0 · −54% | −2.2 · −47% |
| EWG | iShares MSCI Germany ETF | 6.3% · −68% | +0.4 · −47% | +1.9 · −62% | +0.2 · −47% |
| ACWV | iShares MSCI Global Min Vol Factor ETF | 8.4% · −29% | −2.9 · −17% | −1.2 · −17% | −0.5 · −15% |
| INDA | iShares MSCI India ETF | 6.5% · −45% | −3.3 · −26% | −3.5 · −32% | −3.9 · −32% |
| IMTM | iShares MSCI Intl Momentum Factor ETF | 9.9% · −31% | −3.1 · −18% | −3.0 · −35% | −2.7 · −30% |
| IQLT | iShares MSCI Intl Quality Factor ETF | 9.4% · −32% | −1.5 · −17% | −1.9 · −29% | −1.5 · −23% |
| EWJ | iShares MSCI Japan ETF | 4.2% · −59% | −0.4 · −37% | −2.4 · −68% | +0.8 · −41% |
| EWY | iShares MSCI South Korea ETF | 12.0% · −74% | −0.7 · −40% | 0.0 · −47% | −0.4 · −47% |
| EWT | iShares MSCI Taiwan ETF | 10.8% · −63% | −3.1 · −40% | −1.5 · −48% | −3.1 · −47% |
| USMV | iShares MSCI USA Min Vol Factor ETF | 11.5% · −33% | −4.0 · −21% | −0.8 · −16% | −3.7 · −32% |
| MTUM | iShares MSCI USA Momentum Factor ETF | 15.4% · −34% | −4.5 · −27% | −3.7 · −28% | −2.6 · −34% |
| QUAL | iShares MSCI USA Quality Factor ETF | 13.3% · −34% | −3.9 · −21% | −0.9 · −18% | −2.8 · −25% |
| VLUE | iShares MSCI USA Value Factor ETF | 12.5% · −39% | −5.0 · −29% | −0.8 · −23% | −2.8 · −28% |
| EWU | iShares MSCI United Kingdom ETF | 5.0% · −64% | −0.6 · −34% | +0.1 · −49% | −1.8 · −63% |
| URTH | iShares MSCI World ETF | 10.6% · −34% | −4.1 · −24% | −1.1 · −22% | −3.3 · −21% |
| IWF | iShares Russell 1000 Growth ETF | 10.3% · −51% | −0.8 · −22% | +0.1 · −40% | −0.2 · −35% |
| IWM | iShares Russell 2000 ETF | 8.8% · −59% | −3.5 · −31% | +0.2 · −43% | −2.8 · −44% |
| DVY | iShares Select Dividend ETF | 8.5% · −63% | −1.0 · −19% | +0.2 · −49% | −2.9 · −52% |
| VGIT | Vanguard Intermediate-Term Treasury Index Fund ETF Shares | 1.9% · −17% | +0.3 · −4% | 0.0 · −14% | +0.7 · −6% |
| VTIP | Vanguard Short-Term Inflation-Protected Securities Index Fund ETF Shares | 2.5% · −6% | −0.2 · −4% | −0.5 · −6% | +0.1 · −4% |
| VGSH | Vanguard Short-Term Treasury Index Fund ETF Shares | 1.4% · −6% | +0.2 · −2% | +0.1 · −2% | +0.4 · −2% |
| BNDX | Vanguard Total International Bond Index Fund ETF Shares | 2.2% · −16% | 0.0 · −5% | +0.4 · −13% | +0.2 · −9% |
| SHY | iShares 1-3 Year Treasury Bond ETF | 2.0% · −6% | +0.1 · −2% | −0.2 · −2% | +0.2 · −2% |
| TLT | iShares 20+ Year Treasury Bond ETF | 3.4% · −48% | −1.8 · −42% | −1.0 · −47% | −3.2 · −51% |
| IEI | iShares 3-7 Year Treasury Bond ETF | 2.3% · −15% | −0.1 · −6% | −0.1 · −13% | +0.3 · −6% |
| IEF | iShares 7-10 Year Treasury Bond ETF | 3.3% · −24% | −0.9 · −12% | +0.3 · −15% | −0.5 · −16% |
| AGG | iShares Core U.S. Aggregate Bond ETF | 3.0% · −18% | −0.4 · −7% | −0.2 · −13% | +0.1 · −10% |
| MBB | iShares MBS ETF | 2.4% · −18% | −0.5 · −7% | +0.1 · −13% | +0.3 · −9% |
| MUB | iShares National Muni Bond ETF | 3.4% · −14% | −0.1 · −8% | −0.3 · −7% | −0.2 · −9% |
| TIP | iShares TIPS Bond ETF | 3.3% · −15% | −1.0 · −10% | −0.3 · −10% | −0.3 · −15% |
| AOA | iShares Core Aggressive Allocation ETF | 10.0% · −28% | −3.0 · −20% | −0.2 · −16% | −2.4 · −21% |
| AOR | iShares Core Growth Allocation ETF | 7.9% · −23% | −2.0 · −15% | −0.7 · −15% | −1.2 · −13% |
| AOM | iShares Core Moderate Allocation ETF | 5.9% · −20% | −0.7 · −8% | −1.1 · −15% | −0.2 · −9% |
| XLRE | The Real Estate Select Sector SPDR Fund | 7.7% · −39% | −5.6 · −31% | +0.1 · −29% | −1.8 · −39% |
| VNQ | Vanguard Real Estate Index Fund ETF Shares | 7.0% · −73% | −2.7 · −47% | +1.1 · −40% | −4.6 · −69% |
| REET | iShares Global REIT ETF | 4.6% · −45% | −1.6 · −18% | +0.4 · −24% | −1.2 · −25% |
Mutual funds
| Ticker | Instrument | Buy-and-hold | 200-day average | Volatility filter | Volatility stop |
|---|---|---|---|---|---|
| FBNDX | Fidelity Investment Grade Bond | 5.3% · −18% | −0.2 · −7% | +0.1 · −10% | +0.1 · −9% |
| LBNDX | Lord Abbett Bond Debenture | 7.9% · −26% | +0.4 · −8% | +0.2 · −13% | −0.7 · −10% |
| VWEHX | Vanguard High-Yield Corporate | 7.9% · −30% | 0.0 · −10% | −0.6 · −12% | −0.9 · −13% |
| VFICX | Vanguard Intermediate-Term Investment-Grade | 5.3% · −20% | −0.4 · −8% | +0.3 · −14% | −0.1 · −9% |
| VWESX | Vanguard Long-Term Investment-Grade | 7.7% · −36% | −1.2 · −25% | +0.3 · −30% | −1.5 · −37% |
| VFINX | Vanguard 500 Index | 11.2% · −55% | −1.4 · −33% | −1.6 · −52% | −1.0 · −33% |
| VEIEX | Vanguard Emerging Markets Stock Index | 7.2% · −66% | +1.4 · −31% | −0.1 · −49% | +0.4 · −41% |
| VEURX | Vanguard European Stock Index | 8.1% · −63% | −0.5 · −32% | −1.8 · −59% | −1.0 · −38% |
| VEXMX | Vanguard Extended Market Index | 10.6% · −58% | −1.5 · −43% | −0.3 · −51% | −2.1 · −52% |
| VIGRX | Vanguard Growth Index | 11.8% · −57% | +0.1 · −26% | −2.2 · −58% | −0.2 · −38% |
| VIMSX | Vanguard Mid-Cap Index | 10.0% · −59% | −2.7 · −33% | −0.6 · −40% | −1.9 · −32% |
| VPACX | Vanguard Pacific Stock Index | 4.8% · −55% | +0.3 · −28% | −2.1 · −61% | +1.0 · −30% |
| VISGX | Vanguard Small-Cap Growth Index | 9.8% · −59% | −2.1 · −35% | +0.8 · −39% | −2.7 · −45% |
| NAESX | Vanguard Small-Cap Index | 9.0% · −60% | −2.2 · −39% | +0.7 · −40% | −2.0 · −43% |
| VISVX | Vanguard Small-Cap Value Index | 10.3% · −62% | −3.2 · −32% | −0.8 · −40% | −2.2 · −46% |
| VGTSX | Vanguard Total International Stock Index | 5.9% · −61% | +1.0 · −24% | −2.4 · −52% | +0.8 · −27% |
| VTSMX | Vanguard Total Stock Market Index | 10.8% · −55% | −2.1 · −24% | −2.0 · −51% | −1.4 · −35% |
| VIVAX | Vanguard Value Index | 9.9% · −59% | −2.6 · −30% | −2.9 · −59% | +0.1 · −23% |
| FGOVX | Fidelity Government Income | 5.9% · −20% | +0.1 · −9% | −0.1 · −15% | −0.1 · −12% |
| VWAHX | Vanguard High-Yield Tax-Exempt | 6.5% · −17% | +0.4 · −8% | −0.2 · −16% | +0.2 · −8% |
| VIPSX | Vanguard Inflation-Protected Securities | 4.0% · −15% | −0.3 · −8% | 0.0 · −10% | −0.4 · −12% |
| VFITX | Vanguard Intermediate-Term Treasury | 4.4% · −15% | −0.1 · −7% | −0.2 · −13% | 0.0 · −8% |
| VUSTX | Vanguard Long-Term Treasury | 5.9% · −46% | −1.1 · −38% | −0.2 · −43% | −1.9 · −48% |
| VFISX | Vanguard Short-Term Treasury | 3.3% · −7% | 0.0 · −2% | 0.0 · −4% | +0.2 · −2% |
| VBMFX | Vanguard Total Bond Market Index | 5.1% · −19% | −0.3 · −7% | −0.2 · −17% | 0.0 · −13% |
| VWINX | Vanguard Wellesley Income | 9.3% · −22% | −0.7 · −11% | −1.2 · −21% | −0.8 · −20% |
| VGSIX | Vanguard REIT Index | 8.2% · −73% | −2.9 · −41% | +2.2 · −29% | −3.5 · −64% |
Index series
| Ticker | Instrument | Buy-and-hold | 200-day average | Volatility filter | Volatility stop |
|---|---|---|---|---|---|
| AXJOA | ASX 200 | 9.2% · −51% | −1.6 · −19% | −0.9 · −33% | −2.1 · −36% |
| PX1GR | CAC 40 | 7.7% · −64% | −1.9 · −37% | −3.8 · −69% | −1.5 · −36% |
| GDAXI | DAX | 8.3% · −73% | −0.7 · −39% | −0.5 · −72% | −1.2 · −40% |
| SX5T | Euro Stoxx 50 | 9.0% · −65% | −1.7 · −40% | −2.1 · −68% | −1.2 · −34% |
| HSIDV | Hang Seng | 9.6% · −64% | −1.0 · −42% | −2.9 · −66% | −2.2 · −47% |
| N225 | Nikkei 225 | 7.0% · −82% | −0.6 · −40% | −3.8 · −84% | −1.7 · −57% |
| SP500TR | S&P 500 | 11.3% · −55% | −1.6 · −22% | −1.7 · −52% | −0.7 · −31% |
| GSPC_TR | S&P 500 | 9.9% · −84% | +0.2 · −47% | −1.3 · −87% | −1.2 · −71% |
| TOPXDV | TOPIX | 8.4% · −60% | −3.0 · −42% | −4.4 · −53% | −2.6 · −61% |
| TRGSPTSE | TSX | 9.3% · −48% | −1.1 · −24% | −2.7 · −49% | −1.5 · −37% |
What the timing decision sits beside
This paper prices one decision: when to be out of an asset already chosen. The median ETF's annual return changed by −1.8 points under the 200-day average, −0.7 points under the volatility filter and −1.2 points under the volatility stop.
The decision it sits beside is which assets to hold, and the figure usually quoted for it is quoted wrongly. Brinson, Hood and Beebower found in 1986 that a fund's policy mix explained 93.6% of the variation of its returns over time. Ibbotson and Kaplan separated the three different questions that number is used to answer, on 94 US balanced mutual funds over ten years of monthly returns and 58 pension funds over five years of quarterly returns (Financial Analysts Journal, 2000): about 90% of the variability of a typical fund's returns across time, about 40% of the variation among funds, and on average about 100% of the level of return.
Only the middle question is about choosing. The first mostly reflects the market itself. Ibbotson returned to the point in 2010 and wrote that most of that high R-squared "came from aggregate market movement", and that after controlling for interaction effects, about three-quarters of a typical fund's variation in time-series returns comes from general market movement, with the rest split roughly evenly between the fund's specific allocation and active management. The 100% answer is thinner still. Before costs, active returns sum to zero across all portfolios, so policy accounting for the whole return level is, in his words, "a mathematical identity". His conclusion is the sentence worth keeping: asset allocation is very important, but nowhere near 90% of the variation in returns is caused by the specific allocation mix (Financial Analysts Journal 66(2), 2010, pages 18-20, DOI 10.2469/faj.v66.n2.4).
Read that way, the literature and this study point at the same thing from opposite ends. Most of what a fund's return does over time is the market moving, which is what a rule steps out of when it sells; the incremental part is the mix held, which is chosen once and then left alone. A fixed mix bought every month is what What if you invested $1,000 a month in an ETF portfolio? measures, over a different universe and a different question.
What it means
Against each instrument's own buy-and-hold, the 200-day average lifted the median deepest fall by 18.4 points and cost 1.8 points a year. Risk-adjusted, the median Sharpe change was −0.028 under the 200-day average, +0.048 under the volatility filter and −0.005 under the volatility stop, and every 95% interval includes zero.
That is the whole trade, and it is a real one: a shallower deepest fall, paid for in return, on a rule that trades, pays costs and has to be followed through the crisis it is built for. The tables above give it for every instrument tested, so a reader can find their own.
The cost of making that decision in the middle of a fall, with no rule, is measured in What Selling in a Crash and Waiting to Buy Back Cost.
Frequently asked questions
Related
- Missing the 10 Best Days: What That Chart Measures
- What Selling in a Crash and Waiting to Buy Back Cost
- What Followed the Market's Worst Days, and Its Best
- Missing the Best Days in Japan, Europe and Since 1929
- Quantlake Time in the Market Study: Method and Data