.png)

IJR Small-Cap ETF: 1.2% Above Its 10-Month SMA
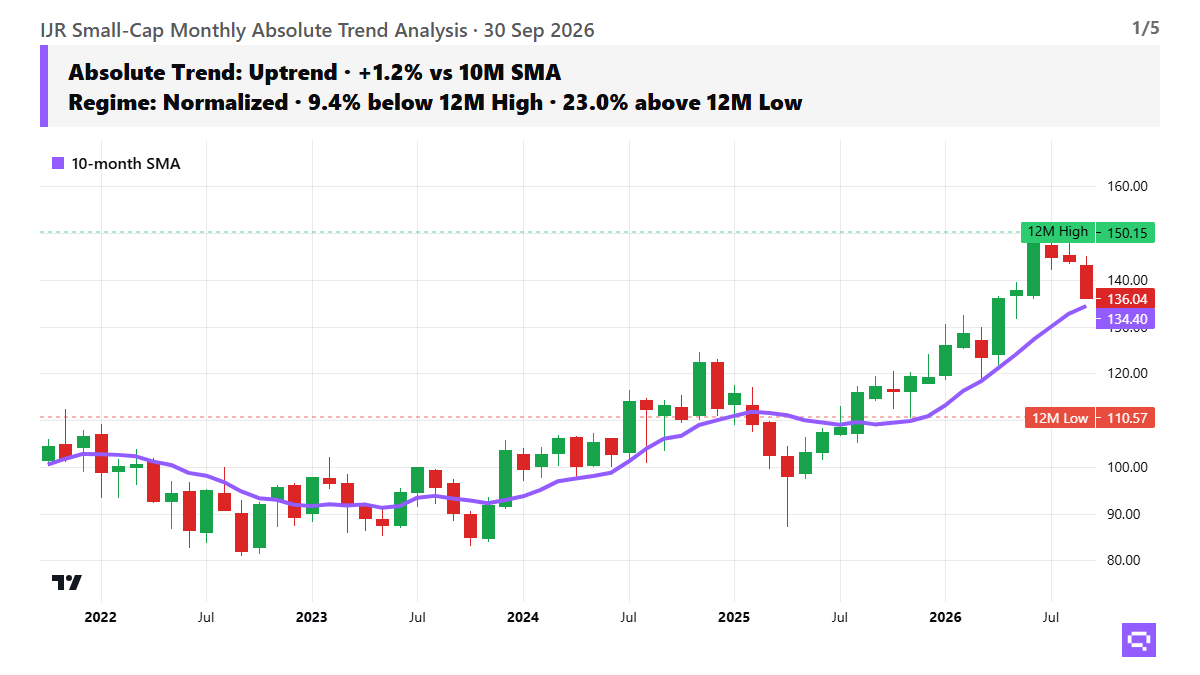
IJR holds 1.2% above its 10-month SMA at $134.4; if it closes below $134.4, that would break the uptrend; SPY relative strength is the main constraint.
Trend & Momentum
iShares Core S&P Small-Cap ETF hovers near long-term trend support, trading at $136.04, 1.2% above its 10-month SMA at $134.4; the average rose 5.7% over three months. Price has held above its 10-month SMA since August 2025, a 13-month tenure. The uptrend rolled over, with 3M at -7.9% after the prior leg cooled. The 6M return is +10.2%, the 12M return is +16.0%, and the 1M return is -5.5%. Over the past 12 months, IJR rose to an August high of $150.15 after a November 2025 low of $110.57. The latest pullback leaves the year’s advance intact and less steady. 1Y realized volatility is 15.6%, against a 3Y average of 18.8% (z-score -1.0). The current pullback sits inside a calmer-than-usual range.
Relative Strength & Market Sensitivity
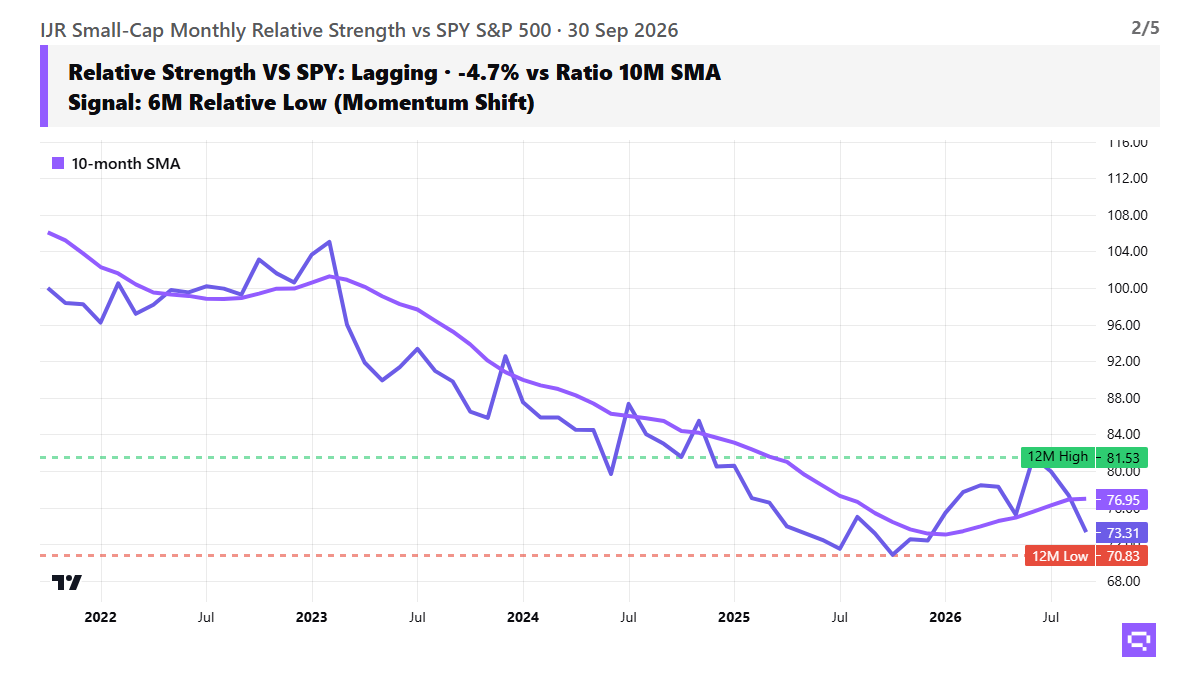
IJR trails the benchmark. The IJR/SPY ratio, indexed to 100 at October 2021, stands 4.7% below its 10-month ratio SMA; the ratio average rose 1.9% over three months and trails by 26.7% since the base. Recent relative performance softened, with excess return at -10.1% over 3M and +0.2% over 12M. After a 12-month ratio low in October 2025, the ratio reached a 12-month high in June, then crossed below its 10-month SMA in September. The ratio’s swing highs are mixed and do not form a clean upward sequence.
Risk & Macro Sensitivity
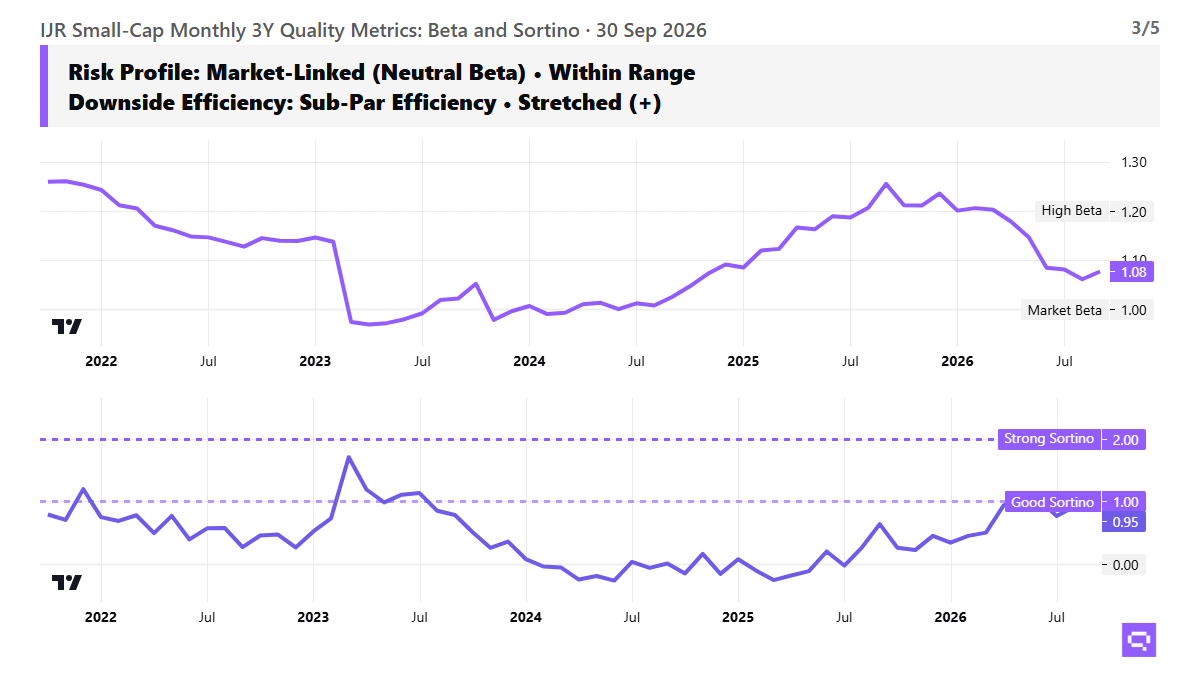
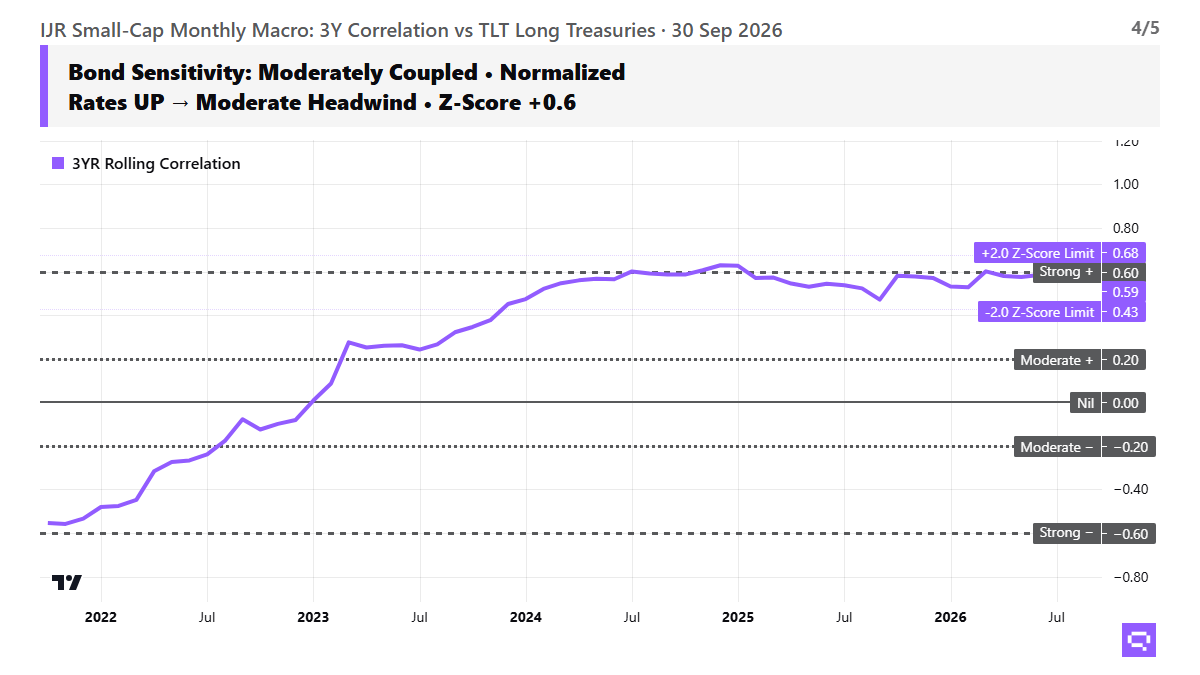
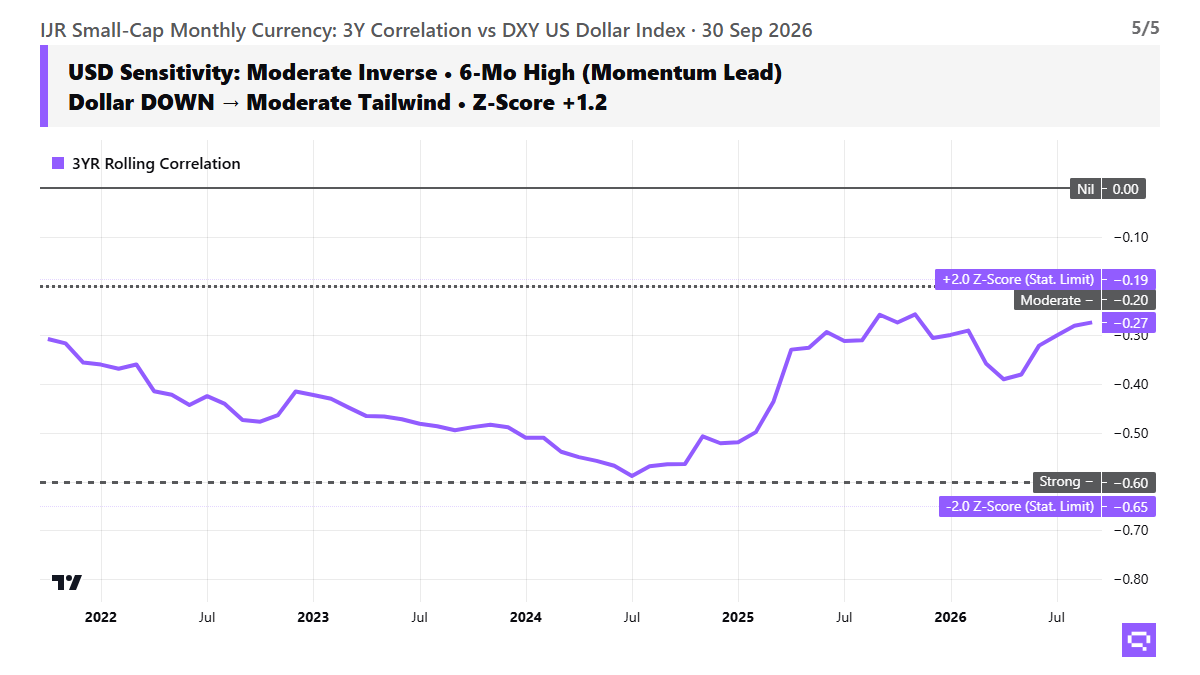
IJR takes market-like risk with weaker downside efficiency, with 3Y beta at 1.08 and 3Y Sortino at 0.95. IJR’s 3Y correlation to Long Treasuries TLT is 0.59. TLT stands 7.2% below its 10-month SMA. IJR’s 3Y correlation to the US Dollar Index DXY is -0.27. DXY stands 2.3% above its 10-month SMA. Beta is market-like, and downside efficiency is weaker over the cycle.
Related
- ETF trend metrics explained: definitions for every measure used above
- Compare ETFs with the Sharpe ratio
- SPY vs RSP: cap-weight vs equal-weight
- GLD vs GDX: bullion vs miners
- MTUM vs QUAL: momentum vs quality
Romain Gandon
CEO, Quantlake
Disclaimer: This article is for informational and educational purposes only and does not constitute investment advice. Past performance is not indicative of future results.