


.png)

XLV Health Care Sector ETF: 9.8% Above Its Rising 10-Month SMA
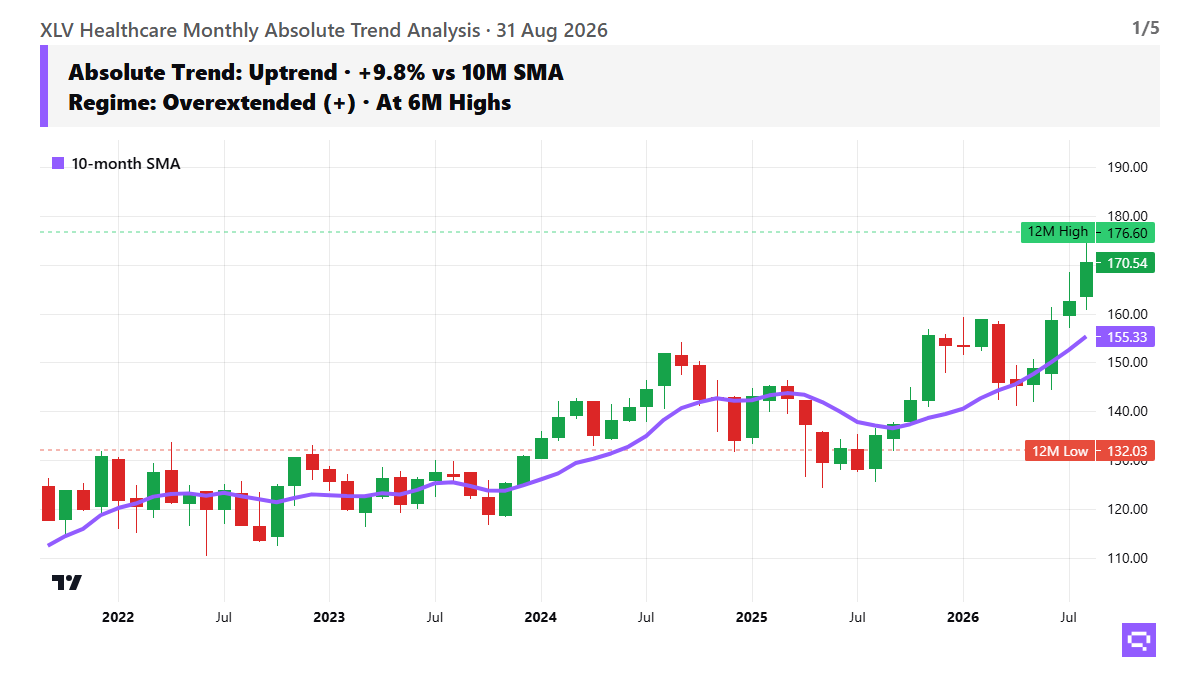
XLV holds +9.8% above a rising 10-month SMA near its 12-month high; a close above 176.6 would extend the uptrend; DXY correlation is a limited constraint.
Trend & Momentum
Health Care Select Sector SPDR Fund holds a firm long-term uptrend, trading at $170.54, 9.8% above its 10-month SMA at $155.33; the average is up 5.2% over three months. The advance accelerated. 3M return is +14.6%, ahead of the prior leg; 6M is +7.4%, 12M is +26.3%, and 1M is +4.9%. Price crossed above its 10-month SMA in May. Over the past 12 months, XLV rose from a September 2025 low of $132.03 to a 12-month high of $176.6 this month and closed 3.4% below that high. The latest leg places the fund near the top of its yearly range. 1Y realized volatility is 15.2% against a 3Y average of 14.2% (z-score 0.8). The uptrend is extended and intact.
Relative Strength & Market Sensitivity
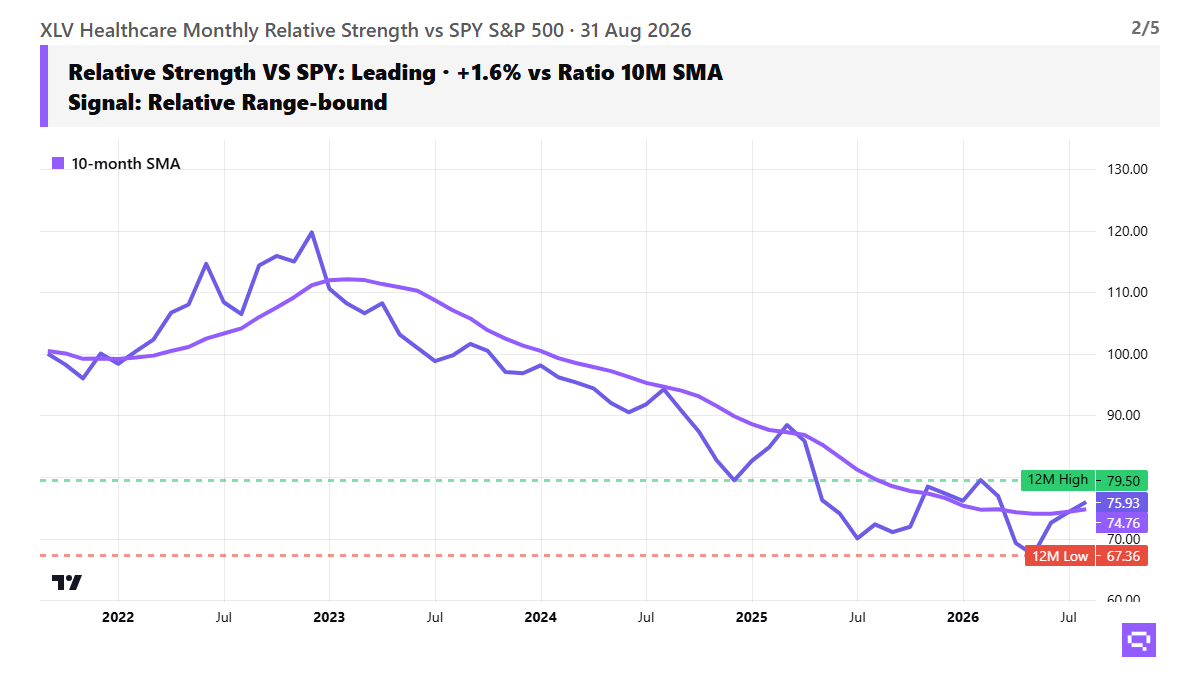
XLV trails the benchmark over the full cycle, though the recent relative swing turned higher. The XLV/SPY ratio, indexed to 100 at September 2021, stands 1.6% above its 10-month ratio SMA; the average is up 1.0% over three months and trails by 24.1% since the base. Recent relative performance turned up, with excess return at +12.7% over 3M and +5.0% over 12M. After a 12-month ratio high in February, the ratio fell to a 12-month low in May, then crossed above its 10-month SMA in August. Relative leadership is mixed. The latest turn points to sustained outperformance versus SPY.
Risk & Macro Sensitivity
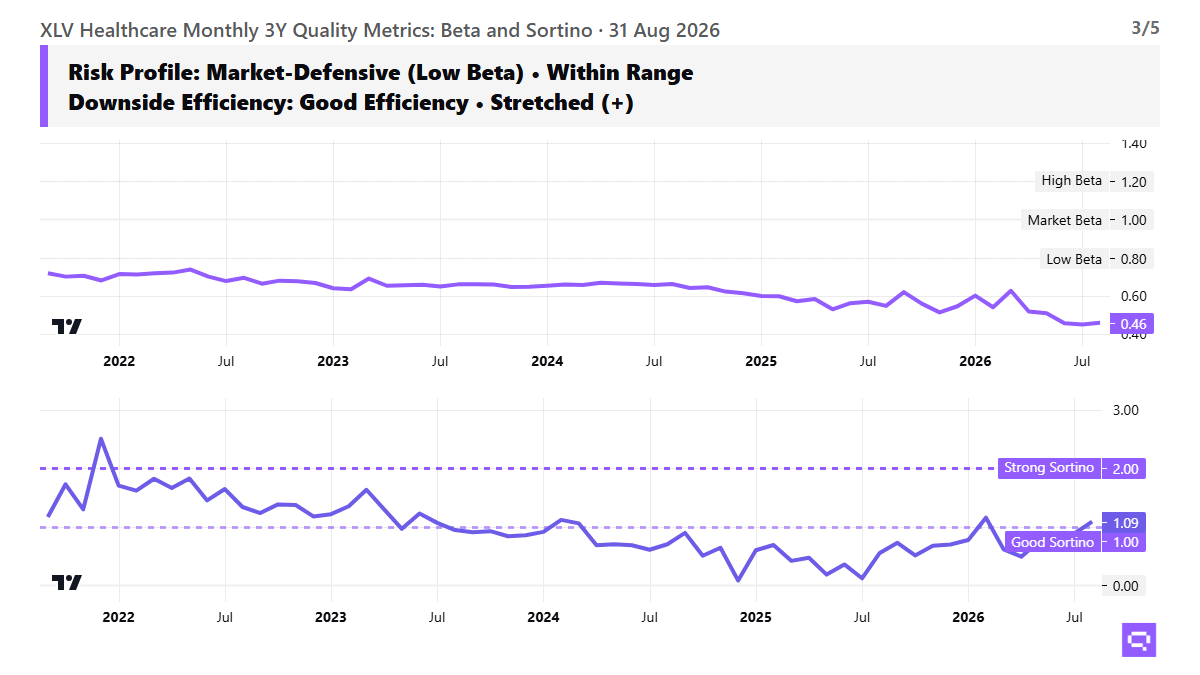
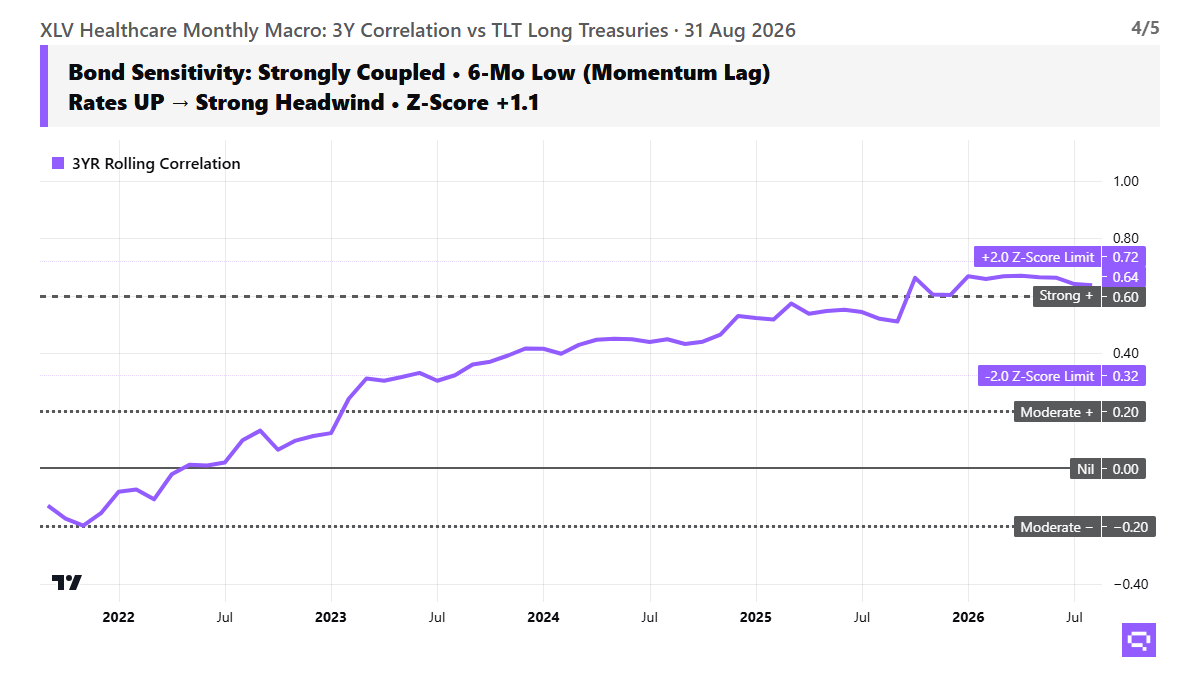
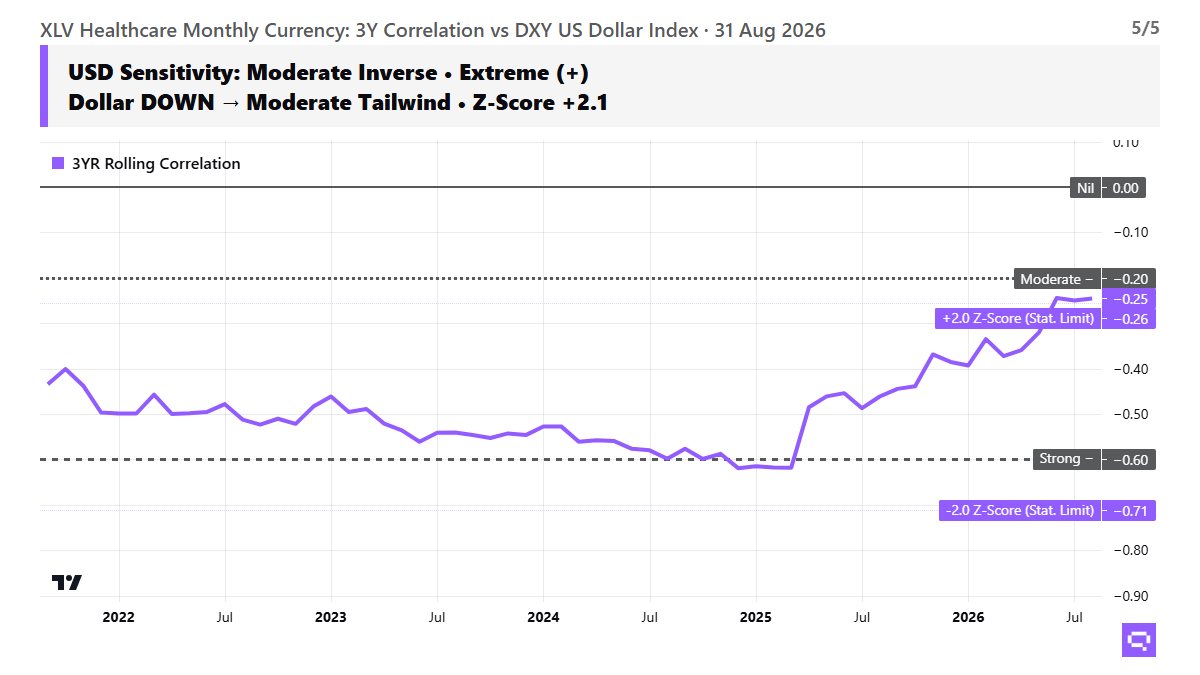
XLV reads defensive with acceptable downside efficiency, with 3Y beta at 0.46 and 3Y Sortino at 1.09. XLV’s 3Y correlation to Long Treasuries TLT is 0.64. TLT sits 2.9% below its 10-month SMA, and the rate backdrop is a headwind. XLV’s 3Y correlation to the US Dollar Index DXY is -0.25. DXY sits 0.5% above its 10-month SMA, and that relationship adds a limited headwind. Risk structure is defensive and moderately efficient over the cycle.
Related
- ETF trend metrics explained: definitions for every measure used above
- Compare ETFs with the Sharpe ratio
- SPY vs RSP: cap-weight vs equal-weight
- GLD vs GDX: bullion vs miners
- MTUM vs QUAL: momentum vs quality
Romain Gandon
CEO, Quantlake
Disclaimer: This article is for informational and educational purposes only and does not constitute investment advice. Past performance is not indicative of future results.


