.png)

Tactical Trends: Korea Slips Below Its 20-Day MA, Equity Leadership Thins
US growth, tech, Japan, and Taiwan make up most of the leaders
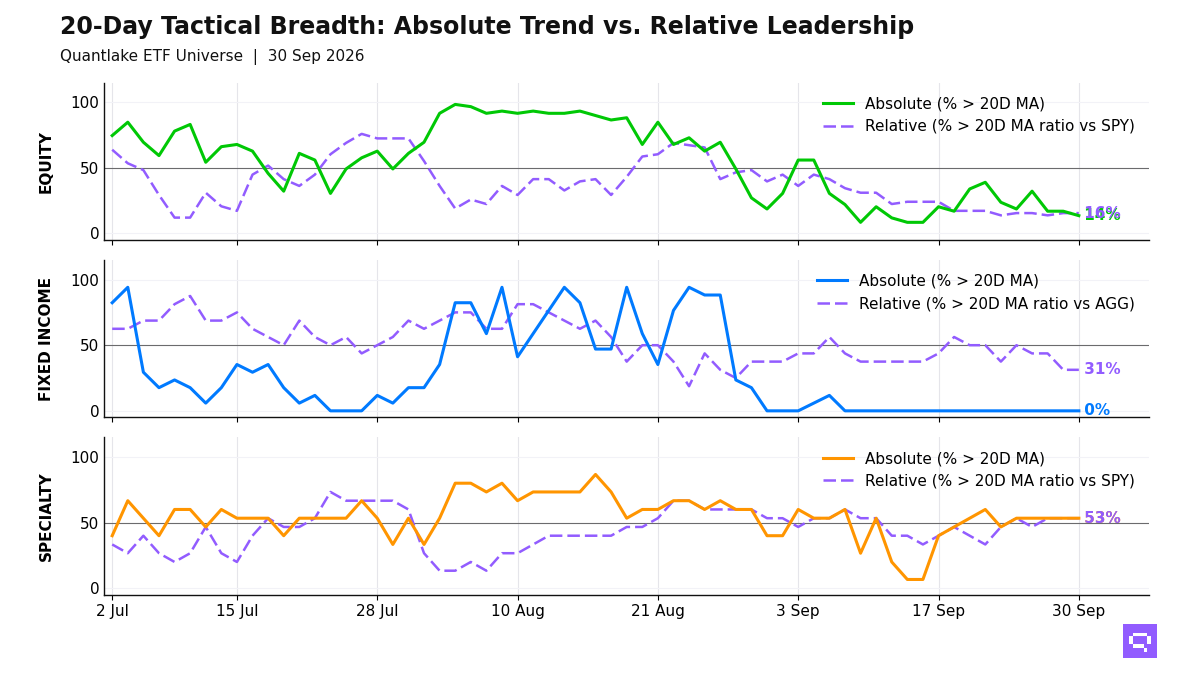
Equity weakness defines the ETF universe at the September 30 close. Only 8 of 59 equity ETFs (14%, -3.4pp on the day) trade above their 20-day moving averages (20D MA), and 9 of 58 (16%, unchanged) outperform the S&P 500 SPY above their ratio MA. Japan EWJ, Taiwan equity, US growth, technology, and quality form the leader cluster. Low volatility, dividend-heavy US equity, developed ex-US, emerging markets, and China fill the laggard cluster. The 14% and 16% readings place equity in a broad bear regime.
Fixed income has no price leaders. At the close, 0 of 17 ETFs trade above their 20D MA. Relative winners vs the Aggregate Bonds AGG are limited to short duration, short Treasuries, and international aggregate. Credit and long duration fill most of the laggard cluster.
Specialty leadership vs the S&P 500 SPY is concentrated in semiconductors, momentum, and digital assets. Precious metals, clean energy, and real estate fill the laggard cluster. Copper CPER crossed below its price MA and its ratio MA vs S&P 500 SPY.
20-Day Tactical Breadth
Key Takeaways
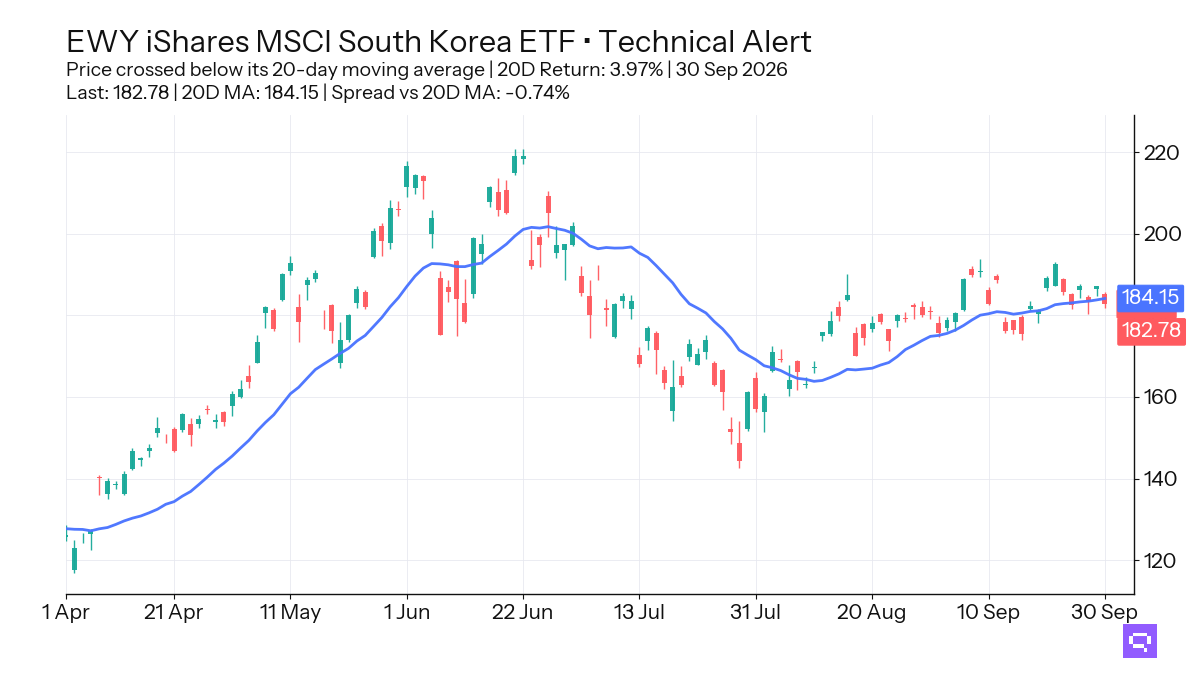
South Korea EWY, up 3.97% over the trailing 20-day window, crossed below its 20D MA. Its ratio vs the S&P 500 SPY also crossed below its ratio MA after a 3.60% relative 20-day gain.
Japan EWJ crossed above its 20D MA and its ratio MA vs the S&P 500 SPY after 2.35% absolute and 1.99% relative 20-day returns. Asia-Pacific equity and Taiwan equity are the international equity themes aligned on price and relative strength across the daily, weekly, and monthly readings.
Healthcare XLV, down 1.52% over the trailing 20-day window, crossed below its 20D MA. Its ratio remains above its ratio MA vs the S&P 500 SPY, which keeps healthcare in the defensive relative-leader bucket. Fixed-income alignment across daily, weekly, and monthly readings is concentrated in International Aggregate BNDX, government Treasuries IEI and VGIT, and short duration VCSH and VTIP.
Featured ETF: iShares MSCI South Korea ETF EWY
Technical Signals
Equity: Price vs 20-day MA
| Signal | Ticker | Name | 20D perf |
|---|---|---|---|
| Cross-up | EWJ | iShares MSCI Japan ETF | +2.35% |
| Cross-down | EWY | iShares MSCI South Korea ETF | +3.97% |
| Cross-down | XLV | Health Care Select Sector | -1.52% |
Equity vs SPY: Price Ratio vs 20-day MA
| Signal | Ticker | Name | 20D rel perf |
|---|---|---|---|
| Cross-up | EWJ | iShares MSCI Japan ETF | +1.99% |
| Cross-down | EWY | iShares MSCI South Korea ETF | +3.60% |
Commodities: Price vs 20-day MA
| Signal | Ticker | Name | 20D perf |
|---|---|---|---|
| Cross-down | CPER | United States Copper LP | +1.82% |
Commodities vs SPY: Price Ratio vs 20-day MA
| Signal | Ticker | Name | 20D rel perf |
|---|---|---|---|
| Cross-down | CPER | United States Copper LP | +1.45% |
Related
- SPY candlestick signals: forward returns by pattern and sentiment
- Fear and greed: today's market sentiment reading
- ETF trend metrics explained
Romain Gandon
CEO, Quantlake
Disclaimer: This article is for informational and educational purposes only and does not constitute investment advice. Past performance is not indicative of future results.