.png)

The 50/30/20 Rule: What the 20% Became Over 23 Years
Saving 20% of income is a rule of thumb, not a calculation. What the 20% becomes is the part the rule leaves out, and it is not one number: across every 10-year stretch since 2003 the same monthly plan ended between 1.3 and 1.8 times what went in.
What a budget is actually for
A budget is not a restriction on spending. It is the mechanism that decides how much money reaches an investment account each month, and that number does more to determine an outcome than any fund selection made afterwards.
The reason is arithmetic. A contribution is certain and a return is not. Raising a savings rate changes the amount invested with certainty, while a better fund choice changes an uncertain rate of return applied to whatever was saved. The budget decides the base; the portfolio only scales it.
Five steps to a working budget
| 1. Count the income | Every source, after tax: salary, freelance work, anything irregular. Use the lowest recent month for variable income rather than the average, so the plan holds in a bad month. |
| 2. Separate fixed from flexible | Rent, utilities and debt payments are fixed for the next few months whatever you decide. Everything else is where a budget actually operates. |
| 3. Name the goal and the date | A deposit in five years and a retirement in thirty are different problems. The date sets the horizon, and the horizon is what decides how much risk the money can carry. |
| 4. Apply 50/30/20 | Half to needs, a third to wants, a fifth to savings and debt. A rule of thumb rather than an optimum, and useful for that reason: the proportions are simple enough to remember and to keep to. The 20% is the line this page measures, because it is the only one that compounds. |
| 5. Re-run it when something changes | A raise, a move, a new dependent. A budget written once is a budget describing someone you no longer are. |
The 20% is the only line that compounds
Half of income covers needs and does not come back. A third covers wants and does not come back. The remaining fifth is the only part of the budget that is still working a decade later, which is why the 50/30/20 rule is really a rule about one number.
The proportions are received wisdom, not a derived result. They come from All Your Worth (Warren and Tyagi, 2005), which set out to explain why middle-class households were going broke on rising incomes. The answer the authors reached was that most families had no clear sense of what they could afford, and the fix they proposed was deliberately crude: three buckets, round proportions, no spreadsheet. Nothing about 50, 30 and 20 is optimal. They are memorable, which for a rule that has to survive twenty years of ordinary months is the more useful property.
Most budgeting guides stop here, hand over a round figure of about 7% a year, and let the reader multiply. That figure is an average of years, and no investor experiences an average of years. They experience the years, in the order they arrive. The block below measures what that difference was worth on real prices.
Two different questions the budget cannot answer alone
A budget answers how much can be invested. It does not answer how much risk that money should carry, and that question splits in two.
Risk capacity is financial. It is set by the horizon, the size of the emergency fund, the stability of the income and whether the money has a claim on it before the horizon arrives. Someone saving for a deposit in three years has low capacity regardless of how they feel about markets. Capacity can be calculated.
Risk tolerance is behavioural. It is what an investor will actually sit through without selling. It cannot be calculated from a balance sheet, because it is not a property of the balance sheet.
The two rarely match, and the gap is where plans fail. High capacity with low tolerance produces a portfolio that gets sold in a drawdown, which converts a temporary loss into a permanent one. Low capacity with high tolerance produces a portfolio that is too aggressive for money that is needed soon. Quantlake profiles both, using BehaviorQuant for the behavioural side, because a portfolio sized to capacity alone is only sized for one of the two constraints.
This matters for every figure further down. A contribution plan produces its result by not being interrupted. The market supplies the return; the investor supplies the uninterrupted sequence of payments, and that part is behavioural.
Why an average return is the wrong planning number
An average is a summary of a distribution, not a description of any year in it. Planning against the average produces a single confident figure for something that was never a single figure, and the gap between the two shows up as surprise rather than as risk.
Two things break the round number. The order of returns matters once contributions are regular, because a late gain lands on a large balance and an early gain lands on a small one. And the start date is an accident of when a person begins earning. The figures below quantify both.
What a monthly plan actually returned
The figures below invest $1,000 at each month end from September 2003, into a 60%/40% portfolio of S&P 500 SPY and Aggregate Bonds AGG rebalanced quarterly. Fees and taxes are excluded, so these are the market's numbers before an investor's own costs. This block refreshes monthly.
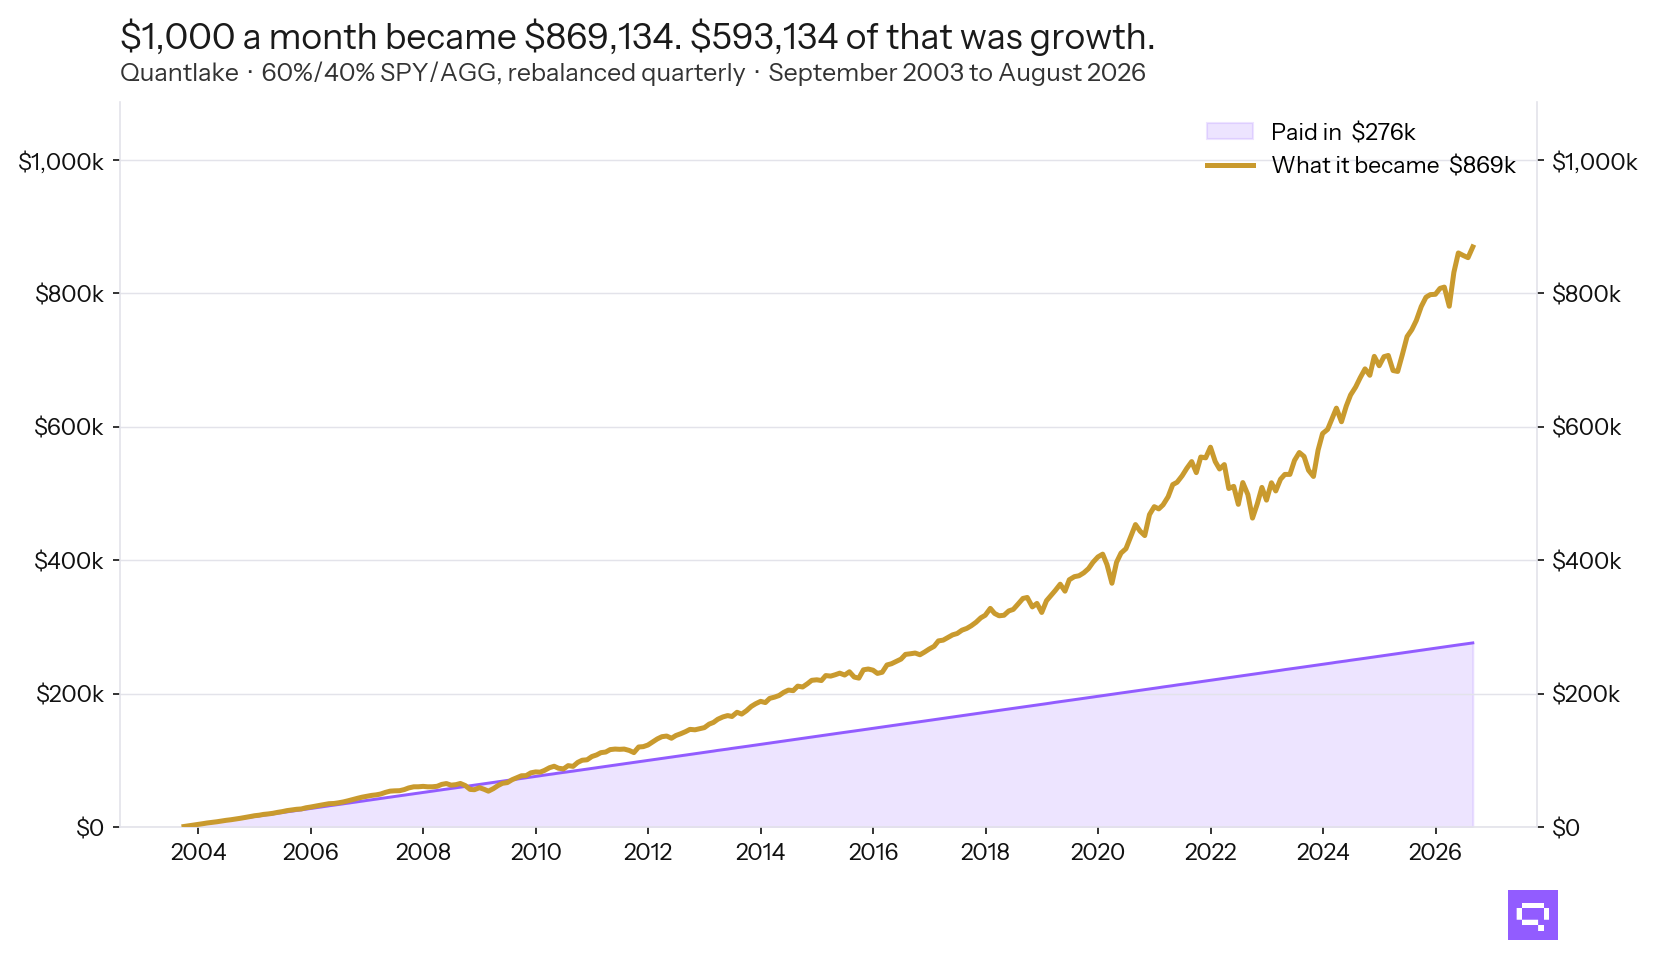
$1,000 invested at each month end for 276 months came to $276,000 paid in and $869,134 at the end. $593,134 of the final balance, or 68%, was growth rather than money saved. Scaling is linear: half the contribution produces half of every figure here.
The average year is not a year anyone had
Over 22 whole calendar years the portfolio averaged 8.5% a year, and compounded at 8.2%. Only 3 of those 22 years landed within two points of the average. The best returned +21.8% in 2019 and the worst −20.6% in 2008, with 3 losing years in total.
A plan built on 8.5% a year would have been describing a year that occurred 3 times out of 22. The average is a property of the sample, not a description of the experience.
The same plan, 157 different start dates
Running an identical 10-year plan from every start month in the sample gives 157 outcomes, shown as a multiple of the money paid in. The median came to 1.57x. The tenth percentile reached 1.45x and the ninetieth 1.69x.
The weakest 10 years ended at 1.35x, to September 2022. The strongest ended at 1.81x, to August 2021. Same contribution, same portfolio, same discipline: the gap between them is 34%, and it is set by nothing the investor chose.
What the figures assume about the investor
Every number above assumes 276 contributions made without a break, including through the −20.6% year in 2008 and through the ten years that ended at 1.35x. The market supplied the return. The investor supplied the uninterrupted sequence, and that is the part no backtest can verify.
A plan stopped in 2008 does not appear anywhere in this table, because it is not a market outcome. It is a behavioural one, and it is why risk capacity and risk tolerance are profiled separately: the allocation an investor can afford and the allocation they will hold through a 21% year are different numbers.
Contributions are invested at each month end into the quarterly-rebalanced portfolio, treated as a total-return index, and valued on the final contribution date. Fees, taxes and spreads are excluded.
Frequently asked questions
Related
- Compound interest calculator with volatility, inflation and fees
- Quantlake model portfolios: Classic and Smart
- Portfolio drift: how far a 60/40 moves on its own
- Compare ETFs with the Sharpe ratio
- ETF trend metrics explained