.png)

Rolling 10-Year Returns and Ranks Across Our ETFs and Funds
The ten years to 2026-06 returned 15.46% a year on the S&P Composite, above 85% of the 1,746 ten-year windows since 1881. The last thirty years sit at the 59th percentile.
Quantlake Time in the Market Study · 127 daily series · data through 31 August 2026 · updated 24 September 2026 · refreshed monthly
Two things to take away. The last decade was strong: the ten years to June 2026 returned 15.46% a year on the S&P Composite, above 85% of ten-year windows since 1881. Stretch the horizon to thirty years and the same end month sits at the 59th percentile, around the middle of the record.
A high ten-year rank describes the past and forecasts nothing. The record since 1871 holds about 15 independent decades, too few to turn what followed earlier strong decades into a probability.
Every other paper here measures what a decision did. This paper measures the backdrop: how much ten- and thirty-year returns have varied, and where the stretch just lived through sits in that record.
That distinction matters for reading the rest. A chart drawn on a strong decade carries a different message from the same chart drawn on a weak one, and knowing which backdrop applies is part of judging how much weight to place on it.
What this paper shows
- The last decade was a strong one, at 15.46% a year against a long-run median of 8.75% and a worst window of −4.02%.
- The last thirty years were ordinary, at the 59th percentile. Decades are volatile; three-decade stretches are much less so.
- A rank describes the past and says nothing about what follows it. The record holds about 15 independent decades, which is too few to turn into a probability.
How much do ten-year returns vary?
A great deal. On Robert Shiller's monthly S&P Composite with dividends, the ten years to 2026-06 returned 15.46% a year, above 85% of the 1,746 windows. The worst ten-year window lost −4.02% a year and the best made 21.18%. The median is 8.75%.
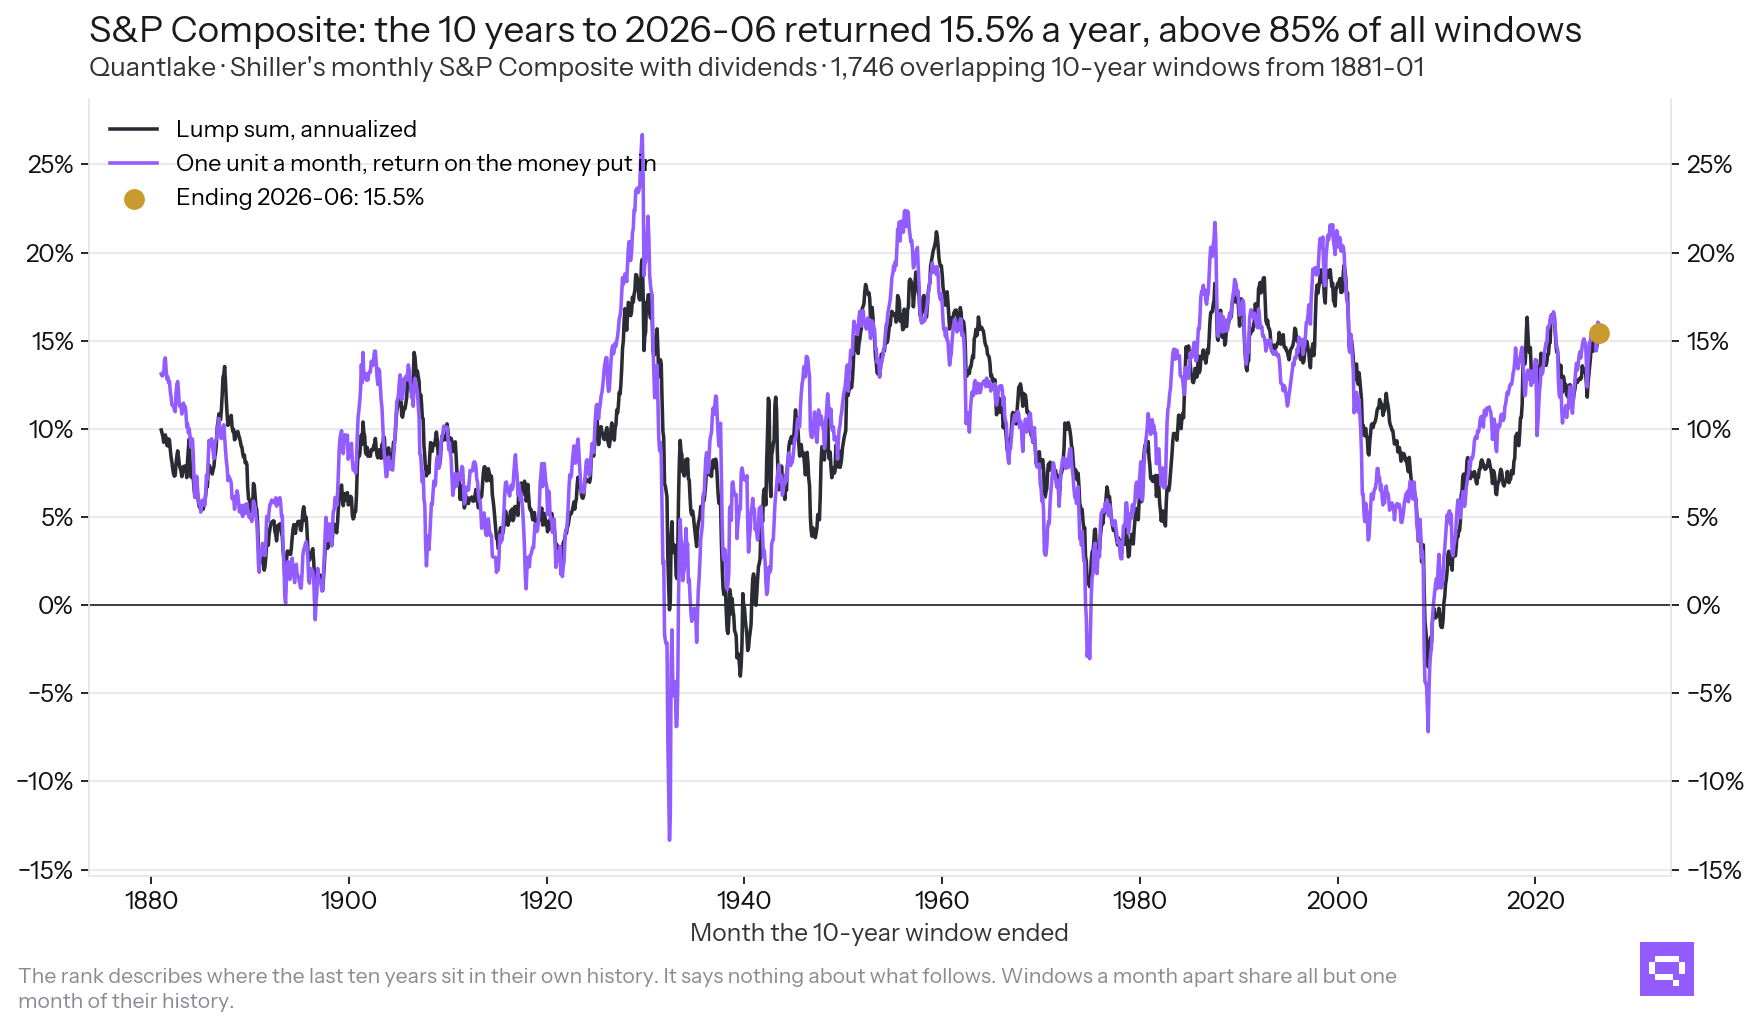
Lump sum and a plan buying one unit a month, by the month each window ended.
After inflation the level changes and the rank barely does: 11.76% a year, the 84th percentile, against a worst window of −5.92%.
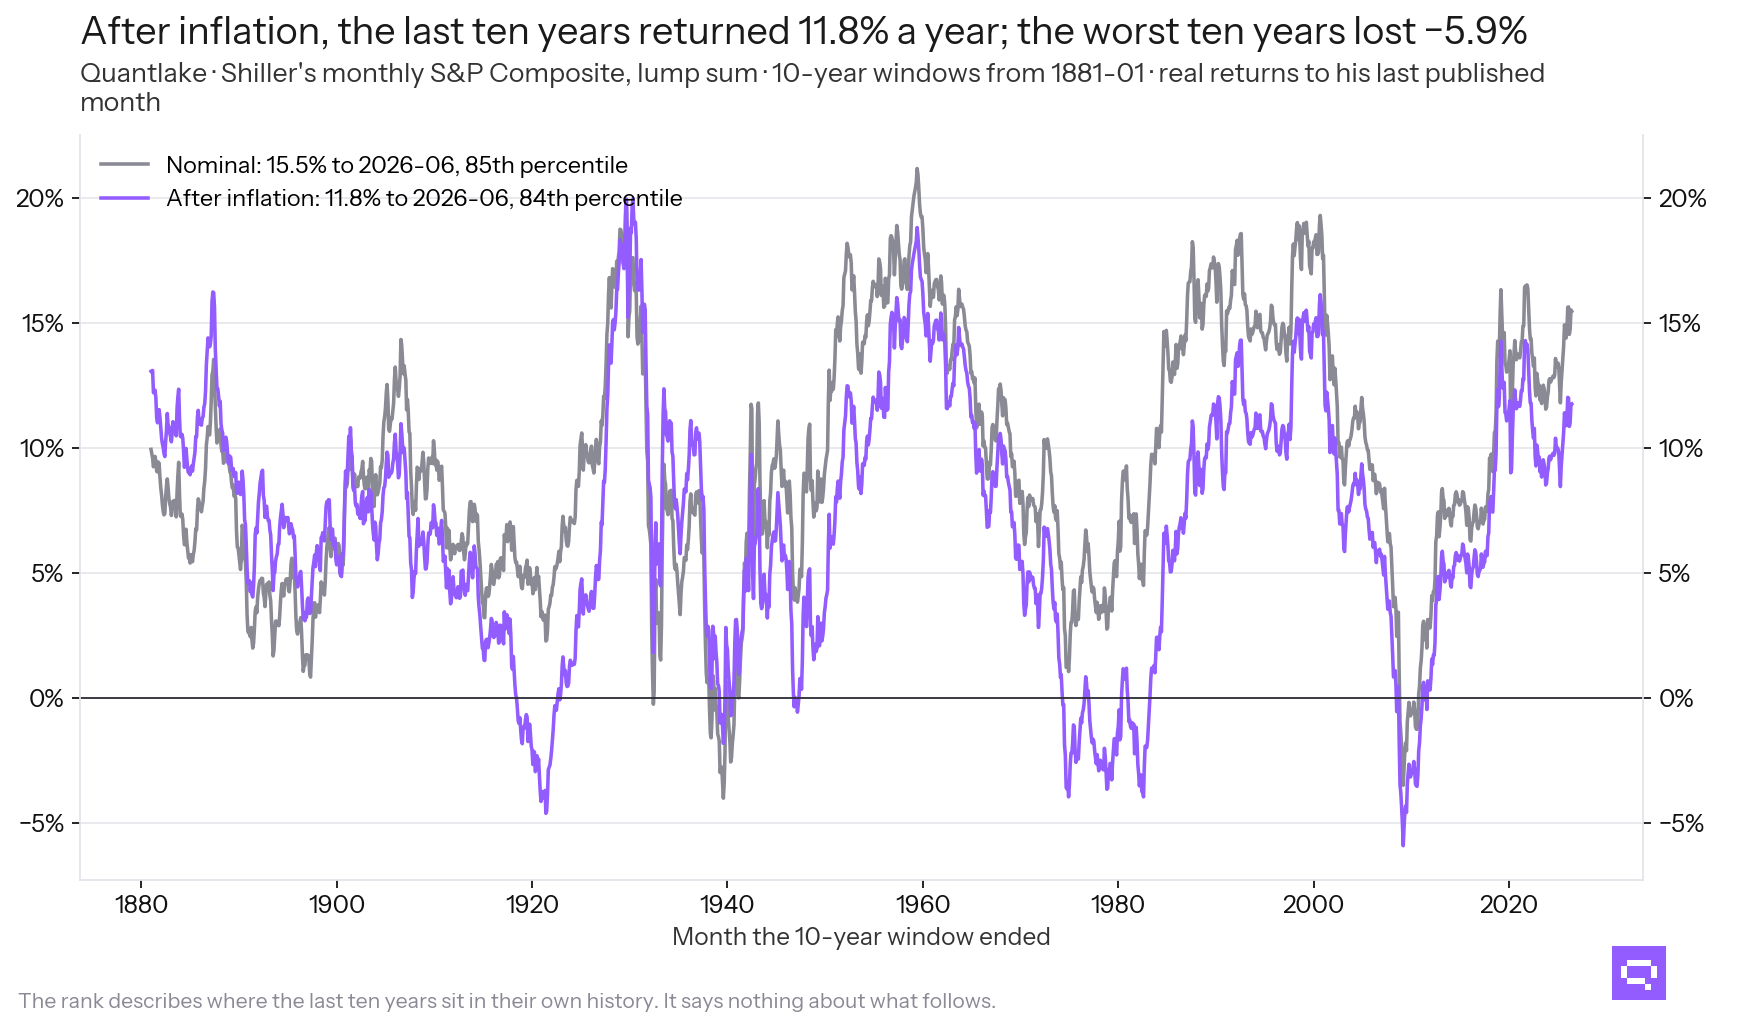
The same windows, deflated.
Does the picture settle down over thirty years?
The gap is large. The thirty years to 2026-06 returned 10.30% a year, the 59th percentile of 1,506 windows, between a worst of 3.64% and a best of 14.32%.
The recent decade is high in its own history. The recent three decades are ordinary. The relevant horizon depends on how long the money is invested.
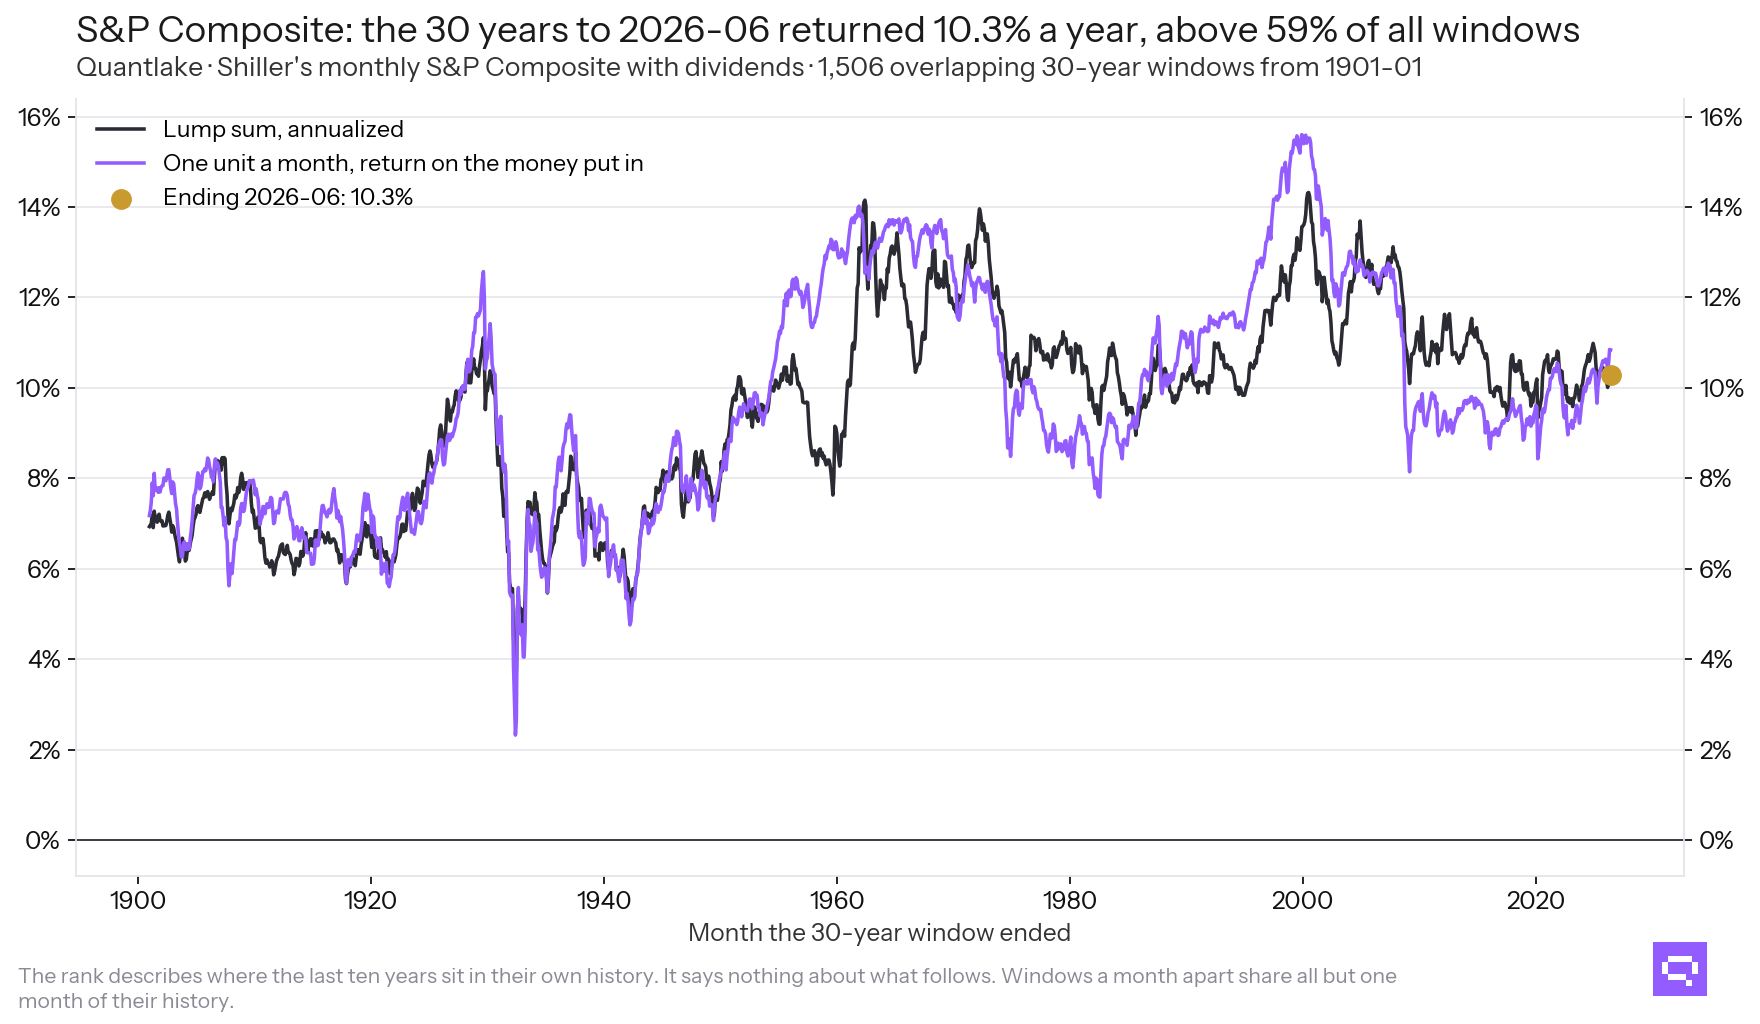
Lump sum and monthly plan.
Is a monthly plan's decade the same decade?
No, and the difference matters before comparing the two. Over the same ten years, a plan's return on the money put in was 15.94%, against 15.46% for a lump sum, and its worst window in the record lost −13.33% a year against −4.02%.
A plan carries most of its money late in the window, so the late years weigh more. The same mechanism is measured across the ETF universe in Does dollar-cost averaging work? A study on ETFs and funds.
What did the last decade look like across the ETF universe?
For the ten years to 2026-08-31, the median of 82 ETFs returned 10.0% a year. The weakest tenth returned 1.7%, and the strongest tenth returned 14.8%.
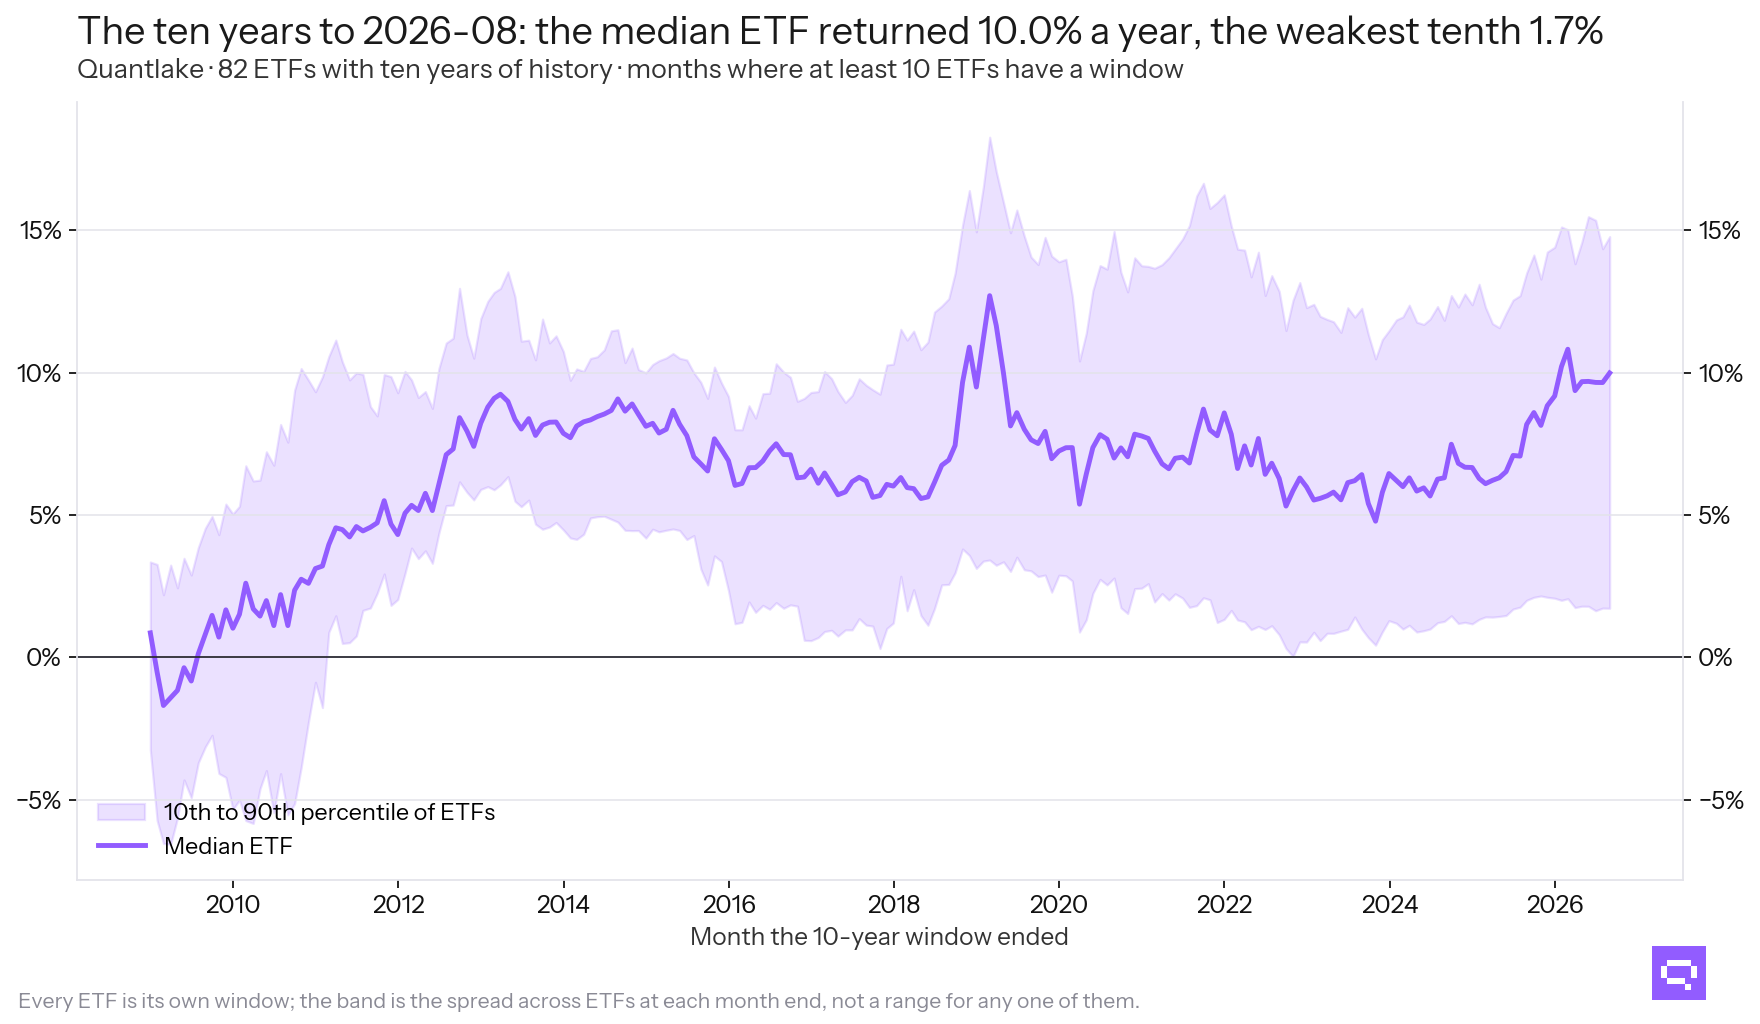
Median and the 10th to 90th percentile.
Where does each market sit in its own history?
The last ten years of the Invesco DB Agriculture Fund (DBA) sit at its 100th percentile, at 5.4% a year. Those of the Vanguard Long-Term Investment-Grade (VWESX) sit at its 0th, at 0.9%. The median ETF sits at the 72nd percentile of its own history.
The 21 mutual funds with thirty-year windows sit at the 11th percentile of their own histories.
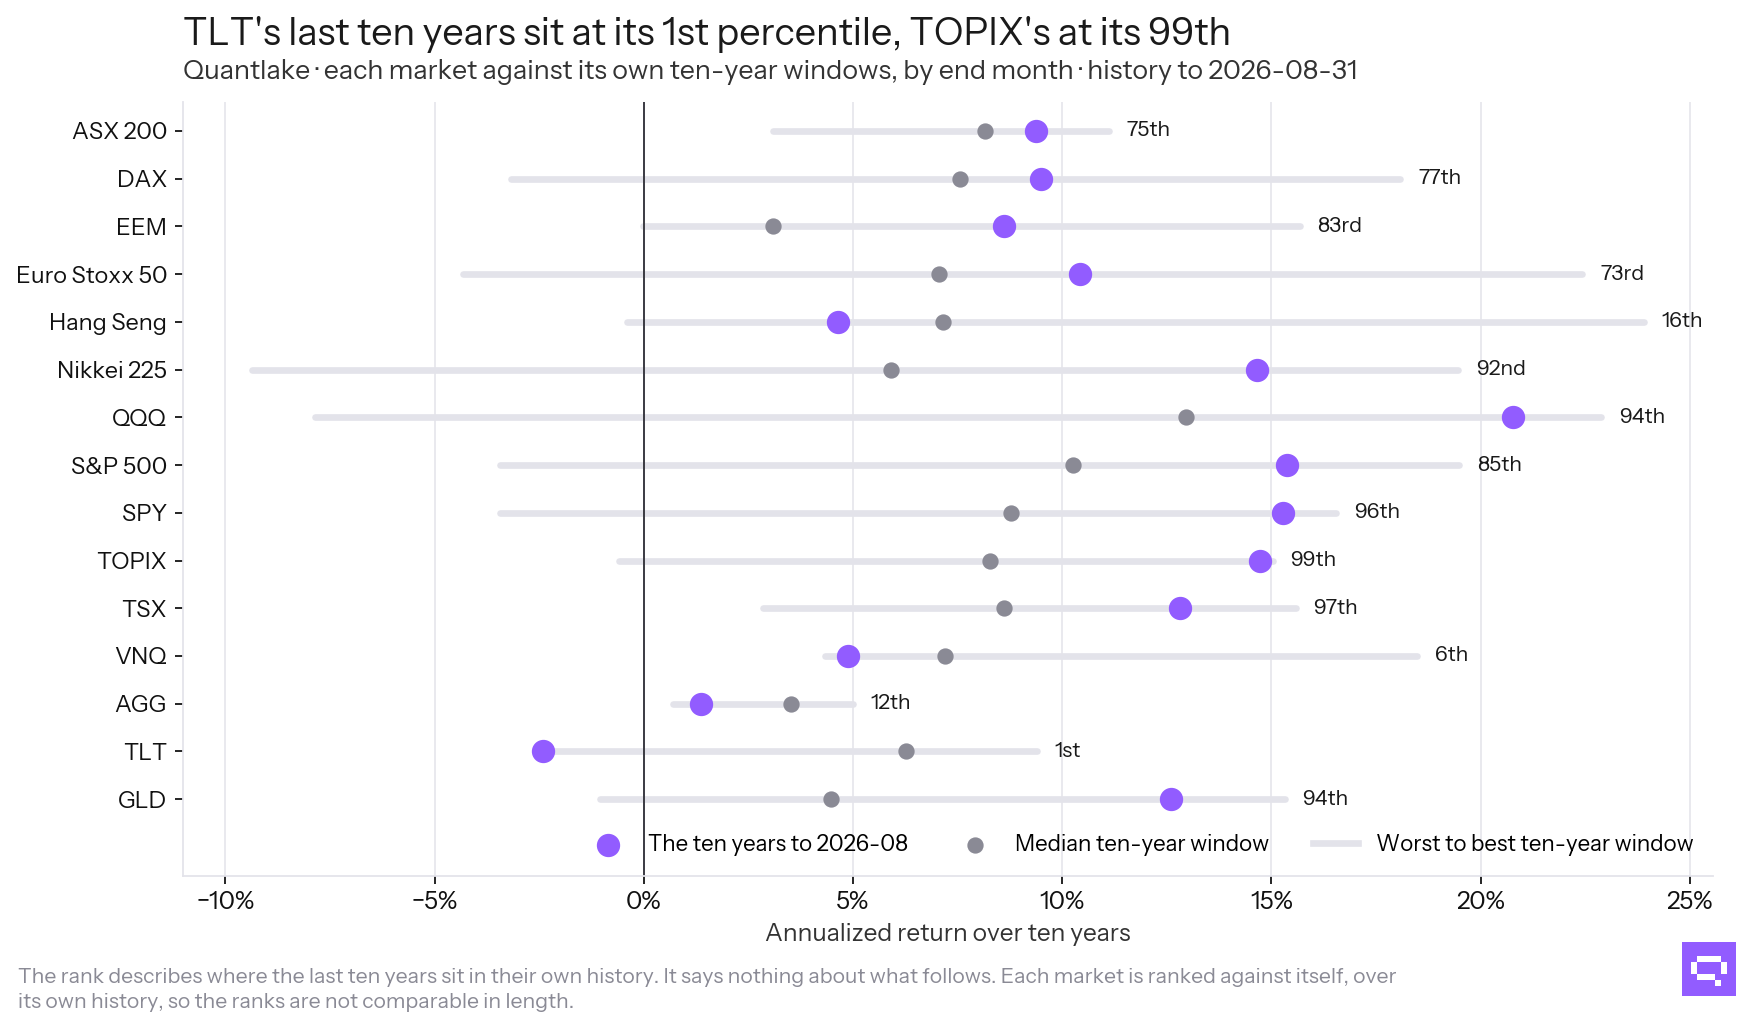
Each market against its own history.
The rank describes where the last ten years sit in each fund's own history. The rank says nothing about what follows, and this study makes no attempt to turn it into a forecast.
Every ETF's last decade, and where it sits in its own record
The table reads in two columns that must be read together. The return is what the last ten years paid. The rank says where that sits among the fund's own earlier ten-year windows, and the last column says how many windows that is. A rank against twelve years of record and a rank against thirty are not the same statement.
Funds with fewer than five years of month-end windows are left out, because a rank against fewer moves in steps too coarse to read.
The same reading over time, on the fund with the longest record on each side: the Vanguard 500 Index Fund and the Vanguard Long-Term Treasury Fund. Their ten-year windows start in 1991 and 1998, against 2004 and 2014 for the ETF equivalents SPY and TLT, so the line has more record behind it. Each point is where that month's trailing ten years ranked among the fund's own windows that had already ended.
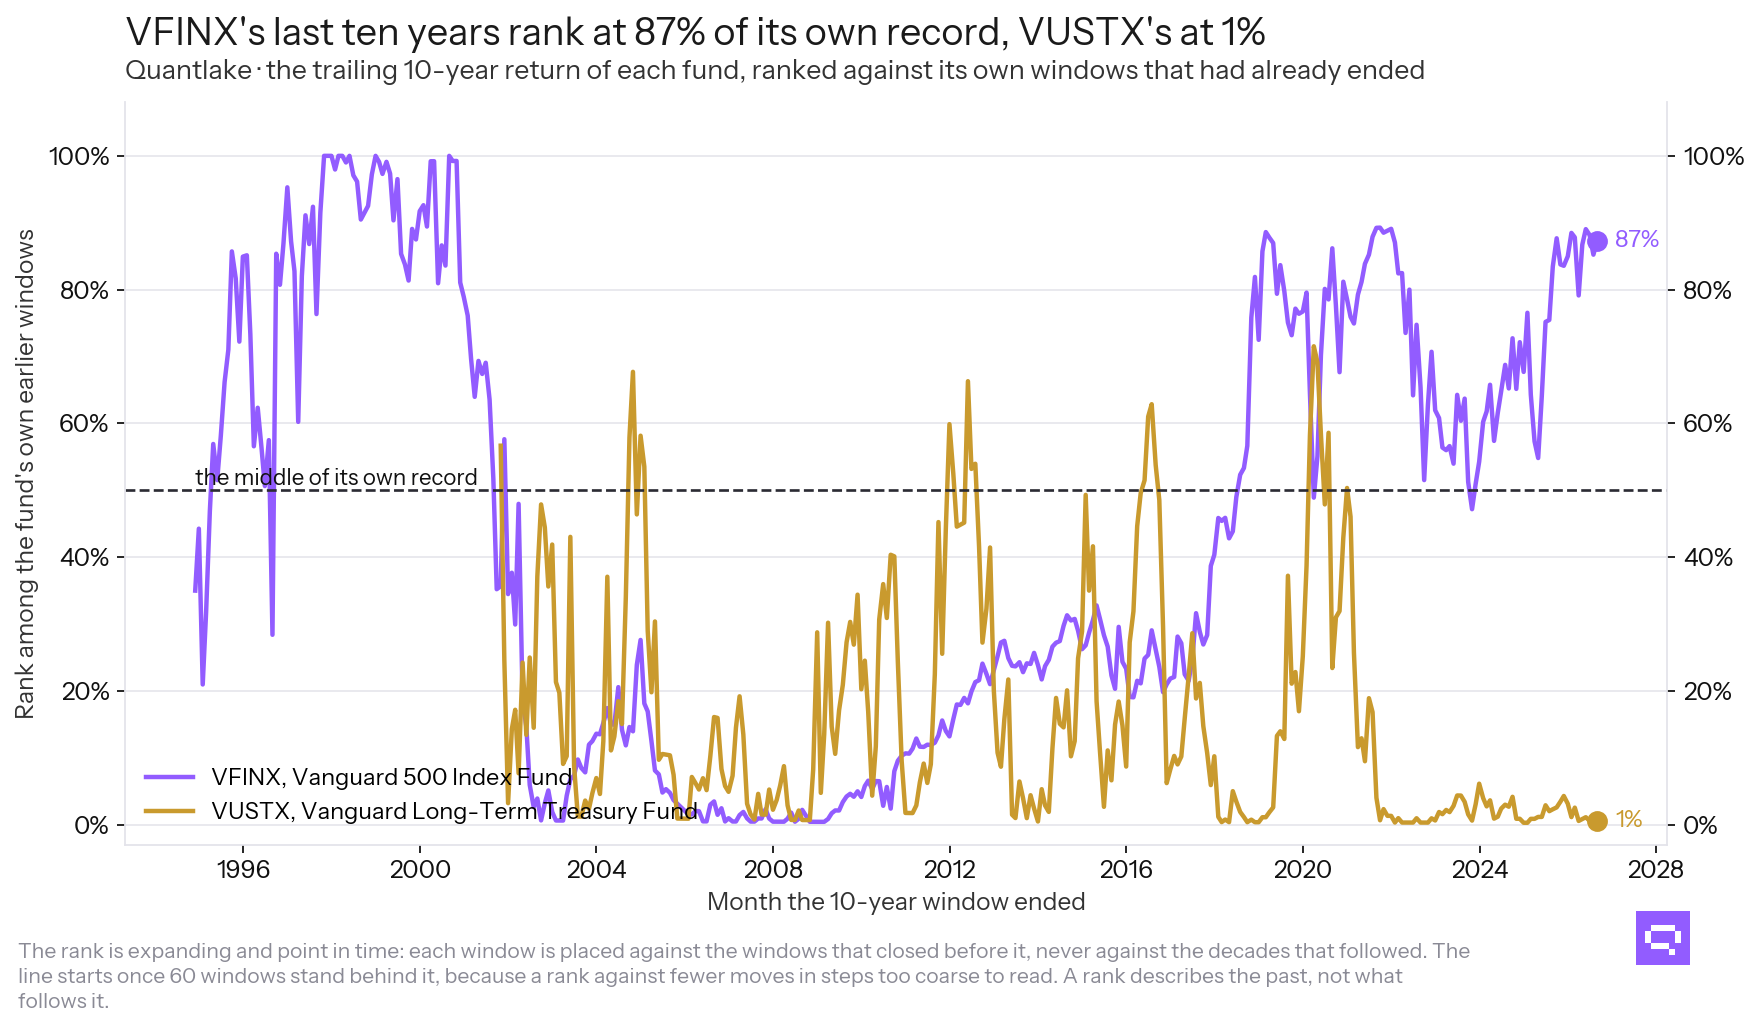
The trailing ten-year return, ranked against the windows that closed before it.
Does a decade's rank say anything about the next one?
The table invites a question that the ETFs cannot answer. A fund with twenty years of prices holds two independent decades. The S&P Composite since 1871 holds 14 pairs of decades that share no month at all, which is enough for a weak statement and not enough for a strong one.
Across every overlapping pair, the rank correlation between a decade's return and the next decade's is −0.23. On the 14 pairs that overlap in nothing, the rank correlation is −0.35. After inflation, the same two readings are −0.34 and −0.53.
Both signs are negative, which is what mean reversion looks like. The decades that followed strong decades were weaker than average. With 14 independent pairs behind it, that is a direction rather than a finding. The overlapping figure rests on windows that share up to 119 of their 120 months. It is reported here so the rank table above is read with it, and no rule follows from it.
What it means
Two things, and a warning about a third.
Ten-year returns ranged from −4.02% to 21.18% a year, and the decade just ended sits near the top of that record. Thirty-year returns varied much less. The last thirty years sit in the middle of their own record.
The warning is separate. What followed high trailing returns is a different question, and the record holds too few independent decades to answer it as a probability. The S&P Composite since 1871 holds about fifteen. The high-return stretches cluster into a handful of episodes. A probability drawn from that record rests on about fifteen observations.
Frequently asked questions
Related
- Missing the Best Days in Japan, Europe and Since 1929
- Missing the 10 Best Days: What That Chart Measures
- Does dollar-cost averaging work? A study on ETFs and funds
- Compound interest calculator with volatility, inflation and fees
- Quantlake Time in the Market Study: Method and Data