.png)
Market Sentiment Breaks 10-Week Fear Cycle
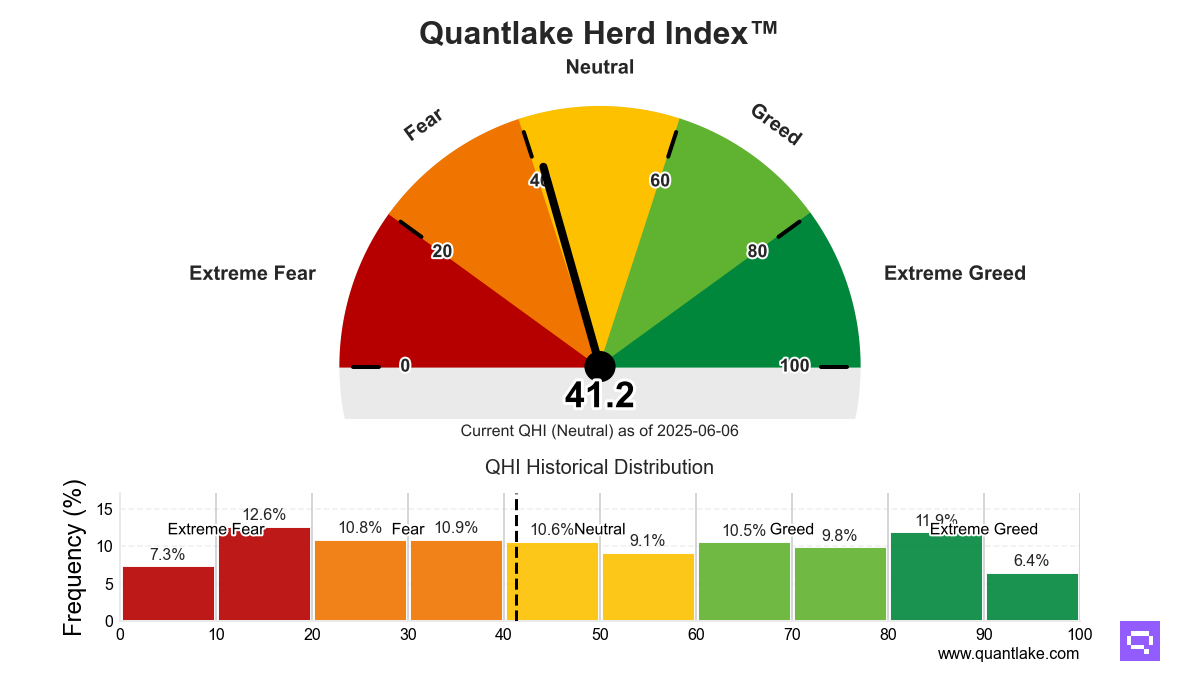
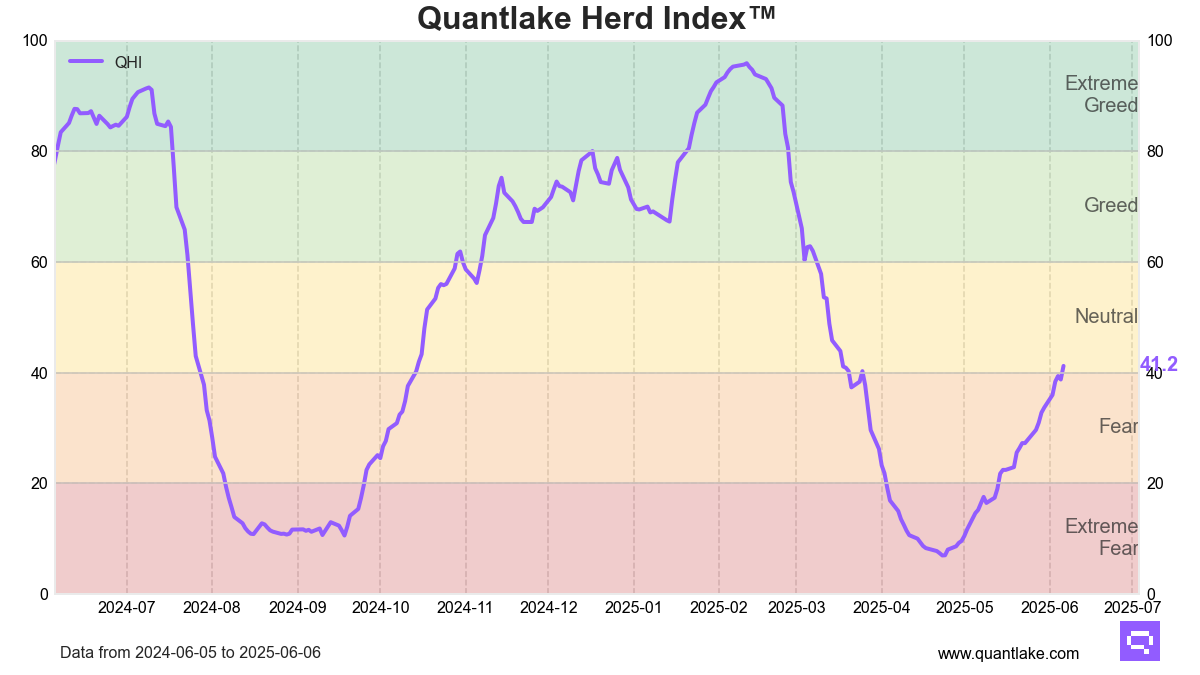
Sentiment Breakout: Market Exits Fear After 73 Days
After 73 days trapped in fear, U.S. market sentiment finally broke free. The Quantlake Herd Index (QHI) closed at 41.2 on June 6, 2025, marking the first transition from Fear to Neutral territory since March—a sentiment breakout that sets the stage for the next phase of market psychology.
The Breakout Details
This Fear-to-Neutral transition represents the first zone change of this type in 73 calendar days. The current reading establishes new highs across multiple timeframes:
- New 1-week high: First time above 40 in recent sessions
- New 1-month high: Highest reading in 30 trading days
- Highest since March 17: Breaking a significant resistance level from earlier this year
The index advanced 2.5 points in the most recent session, continuing an accelerating upward trajectory that has captured the attention of sentiment-focused market participants.
Momentum Building Steam
Recent momentum tells a story of accelerating sentiment improvement:
Short-term Gains:
- 5 trading days: +7.5 points
- 10 trading days: +13.9 points
- 20 trading days: +23.7 points
The momentum is not just positive—it's accelerating. The latest 5-day gain exceeded the previous 5-day period by 1.1 points, suggesting building conviction in the sentiment shift rather than a mere technical bounce.
Positioning Context
The current level reveals interesting positioning dynamics across different timeframes:
Above Short-term Averages:
- 44.7% above the 1-month average (28.5)
- 76.0% above the 3-month average (23.4)
Below Longer-term Benchmarks:
- 19.6% below the 6-month average (51.3)
- 18.4% below the 12-month average (50.5)
This positioning reflects a market in the early stages of sentiment recovery—breaking free from recent pessimism while still working to regain longer-term equilibrium levels.
Statistical Profile
From a statistical standpoint, current conditions remain well within historical norms:
- Percentile Ranking: 43.4th percentile of all historical observations
- Z-Score: -0.29 (within typical bounds)
- Current Volatility: 1-month standard deviation of 7.8 vs. historical average of 8.1
- Streak Status: No active directional streak
The contained volatility is particularly noteworthy—sentiment is shifting without the wild swings that often characterize major inflection points.
Transition Probabilities
This marks the 57th recorded Fear-to-Neutral transition in the QHI's history. Historical outcomes from similar starting points show:
- Return to Fear: 50.9% of cases
- Advance to Greed: 49.1% of cases
The Neutral zone itself has historically lasting power:
- Average duration: 7.6 trading days
- Range: 1 to 35 trading days
- Historical time spent: 19.7% of all observations
These statistics underscore that while the breakout is significant, the path forward remains genuinely uncertain based on historical precedent.
Return Profile Analysis
Historical returns by sentiment zone reveal distinct patterns that provide context for current positioning:
Historical Returns by Sentiment Zone:
- Extreme Fear: 2.70% (1M) | 5.75% (3M)
- Fear: 1.50% (1M) | 4.26% (3M)
- Neutral: 1.44% (1M) | 4.31% (3M) ← Current Zone
- Greed: 0.66% (1M) | 1.92% (3M)
- Extreme Greed: -0.36% (1M) | 1.39% (3M)
- SPY Baseline: 1.20% (1M) | 3.54% (3M)
The data reveals a clear pattern: fear-based sentiment zones have historically coincided with above-average forward returns, while extreme optimism has typically preceded below-average performance.
What This Means for Different Investors
For Contrarian Investors: The move to Neutral represents a step away from the historically attractive Fear zone, though conditions haven't yet reached levels that contrarians typically avoid.
For Momentum Followers: The accelerating pace of sentiment improvement, combined with technical breakouts to new short-term highs, provides the type of setup that momentum strategies often target.
For Risk Managers: The contained volatility during this transition suggests an orderly sentiment shift rather than a volatile snap-back, potentially offering better risk-adjusted opportunities.
Looking Ahead
The QHI has successfully exited a prolonged fear period, breaking a 73-day streak and establishing itself in neutral territory for the first time since March. Recent momentum metrics show acceleration rather than exhaustion, while volatility remains well-contained.
However, the historical record following similar transitions shows roughly balanced outcomes between continued improvement and reversion to fear. The Neutral zone itself has historically lasted just over a week on average, suggesting the current setup may resolve relatively quickly in either direction.
Key levels to watch:
- Above 60: Entry into Greed territory
- Below 40: Return to Fear zone
- Around 50-55: Historical longer-term average range
Summary
Market sentiment has achieved a meaningful breakout after an extended period of fear-based readings. The transition occurs with accelerating momentum, contained volatility, and positioning that places current levels above recent averages but below longer-term benchmarks. While historical precedent suggests balanced probabilities for the next directional move, the orderly nature of this sentiment shift provides a constructive backdrop for evaluating market conditions.
Romain Gandon, CEO & Founder of Quantlake
🔗 LinkedIn
This analysis is based on historical sentiment patterns and does not constitute investment advice. Past performance of sentiment indicators does not guarantee future results.
The Quantlake Herd Index measures U.S. equity market sentiment using a proprietary blend of market-based indicators. Data as of June 6, 2025.