.png)

Intermediate Trends: Equity Breakdown Concentrates in Growth and Asia
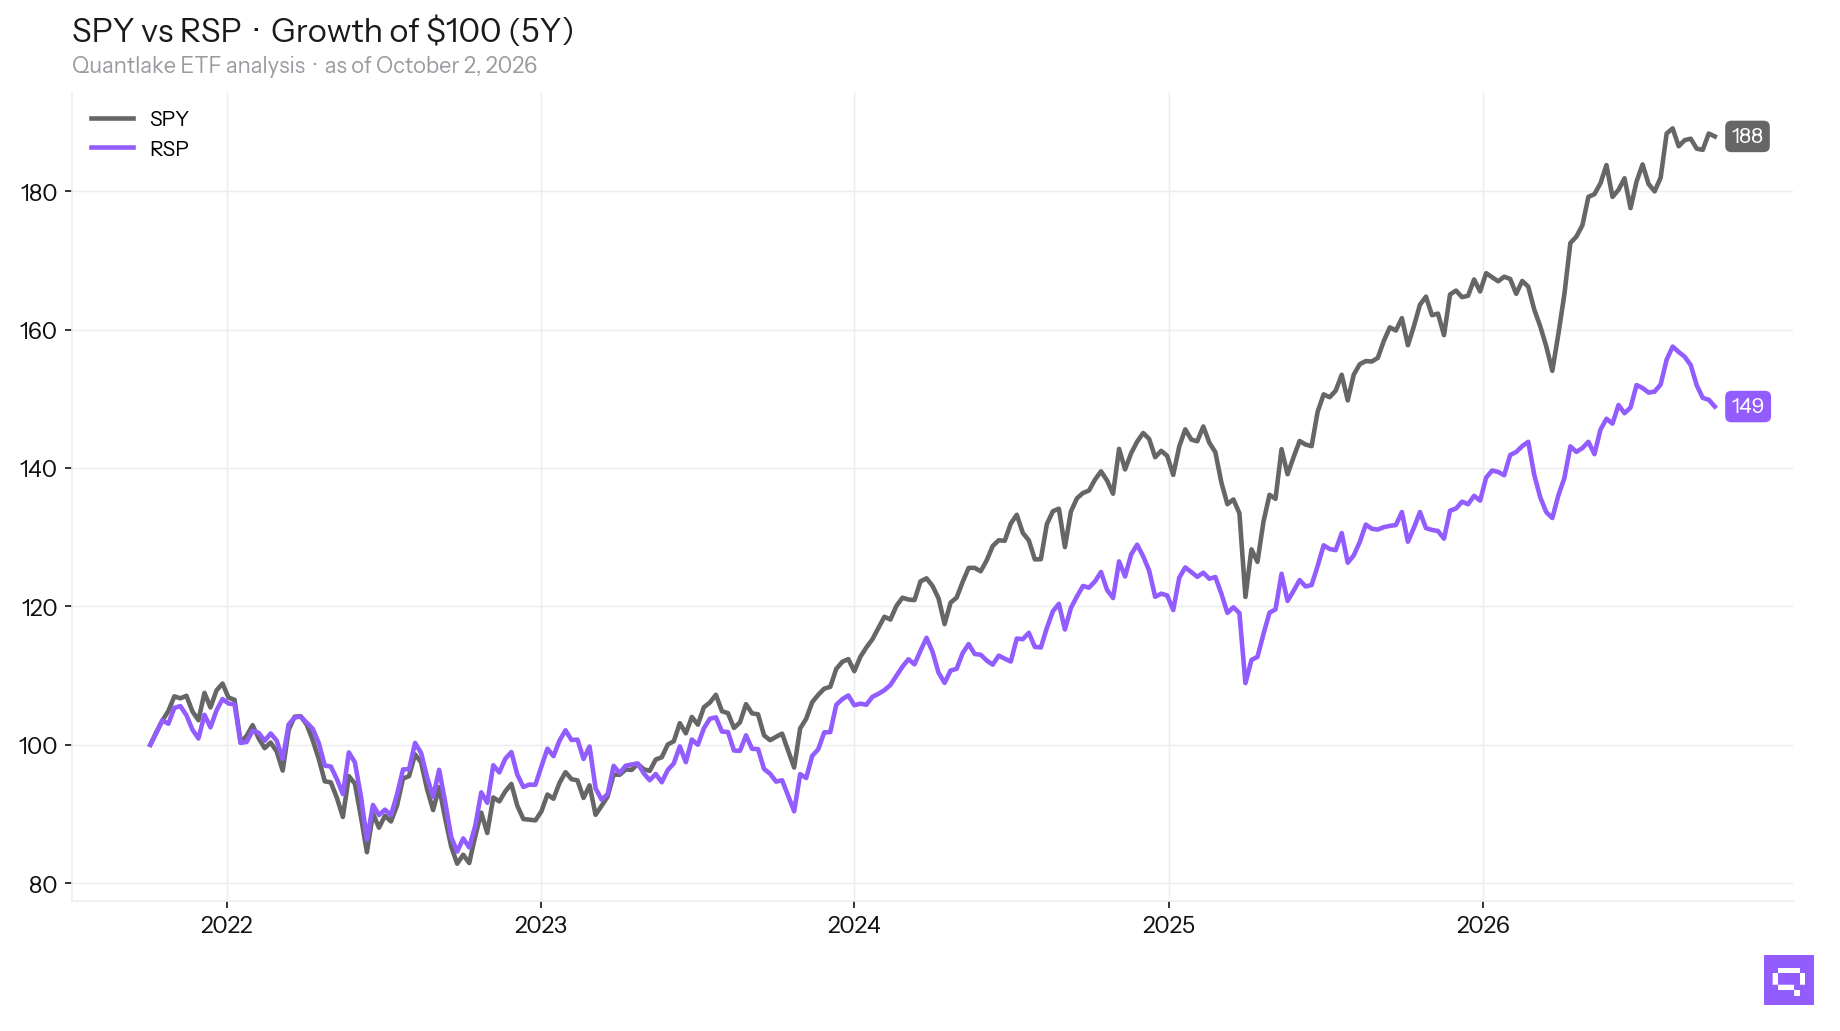
Only 12 of 58 equity ETFs beat S&P 500 SPY at the close.
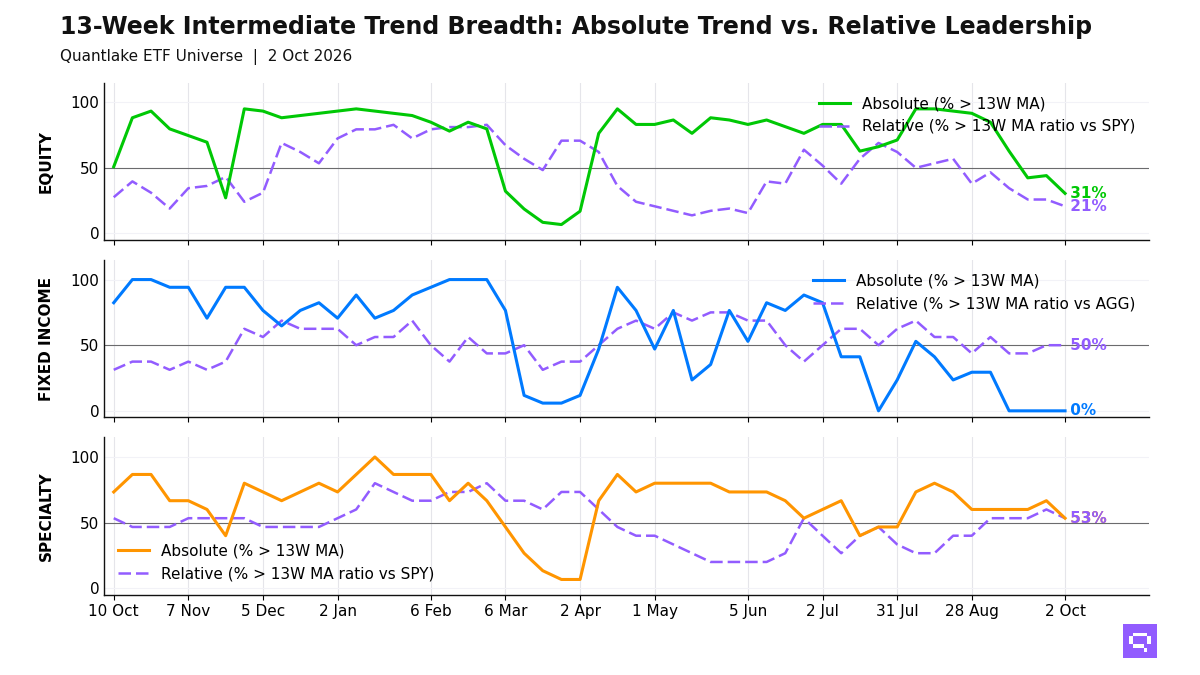
Equity participation broke lower into the October 2 close. Eighteen of 59 ETFs (31%, -13.6pp on the week) stand above their 13-week moving averages (13W MA), and only 12 of 58 (21%, -5.2pp) stand above their ratio MA vs S&P 500 SPY. Relative winners concentrate in Asia-Pacific equity and U.S. growth, led by Taiwan equity EWT and South Korea equity EWY. Low-volatility, developed ex-US, and income-oriented U.S. equity fill the laggard cluster. Equities are in a broad bear breadth regime.
Fixed income has no price winners. All 17 ETFs rank below their 13W MA. Relative winners vs Aggregate Bonds AGG are limited to short duration, intermediate Treasuries, higher-yield credit, and International Aggregate BNDX. Long duration, higher-quality credit, and EM debt lag.
Specialty leadership vs S&P 500 SPY stays with semiconductors, bitcoin proxies, momentum, and biotech. The lagging side includes gold, real estate, clean energy, and gold miners. Commodities weakened, with Agriculture Basket DBA and Silver SLV crossing below their 13W MA and copper lagging S&P 500 SPY.
13-Week Intermediate Breadth
Key Takeaways
Cross-timescale equity alignment is 54%. Asia-Pacific equity and U.S. growth occupy the relative-leading side across daily, weekly, and monthly horizons. Low-volatility, developed ex-US, and dividend-oriented U.S. equity align on the lagging side.
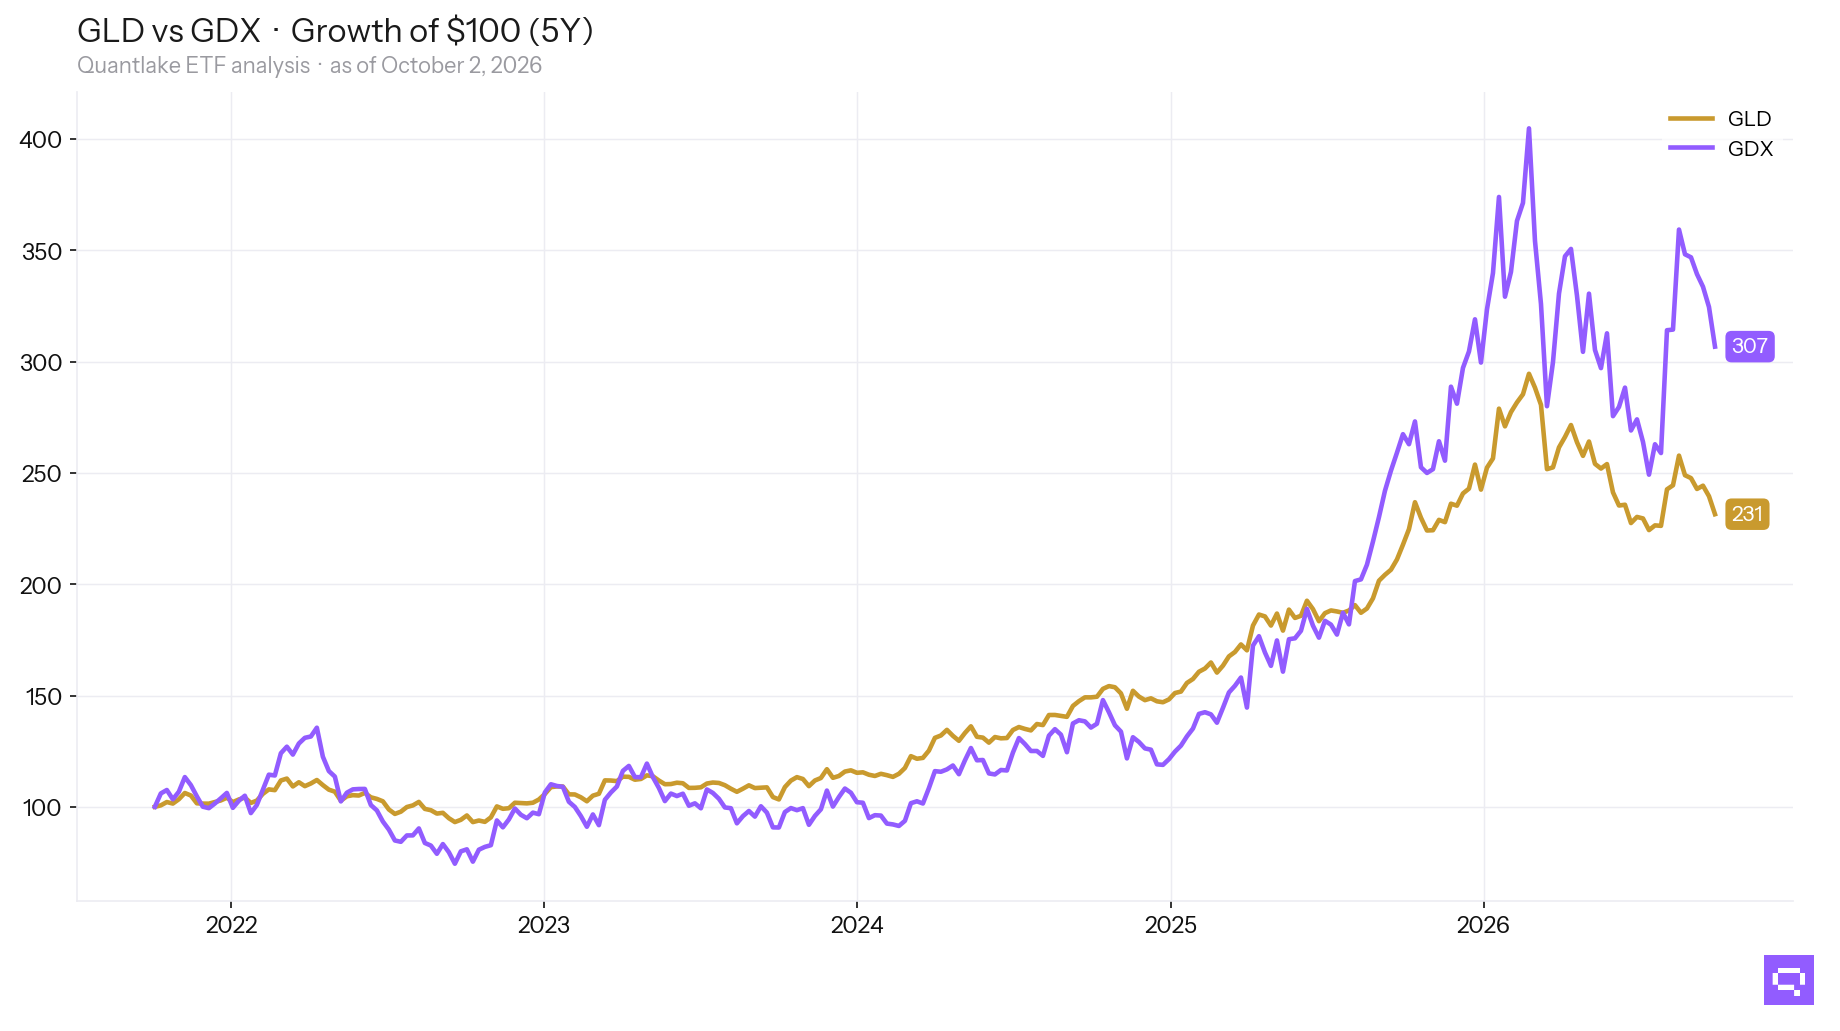
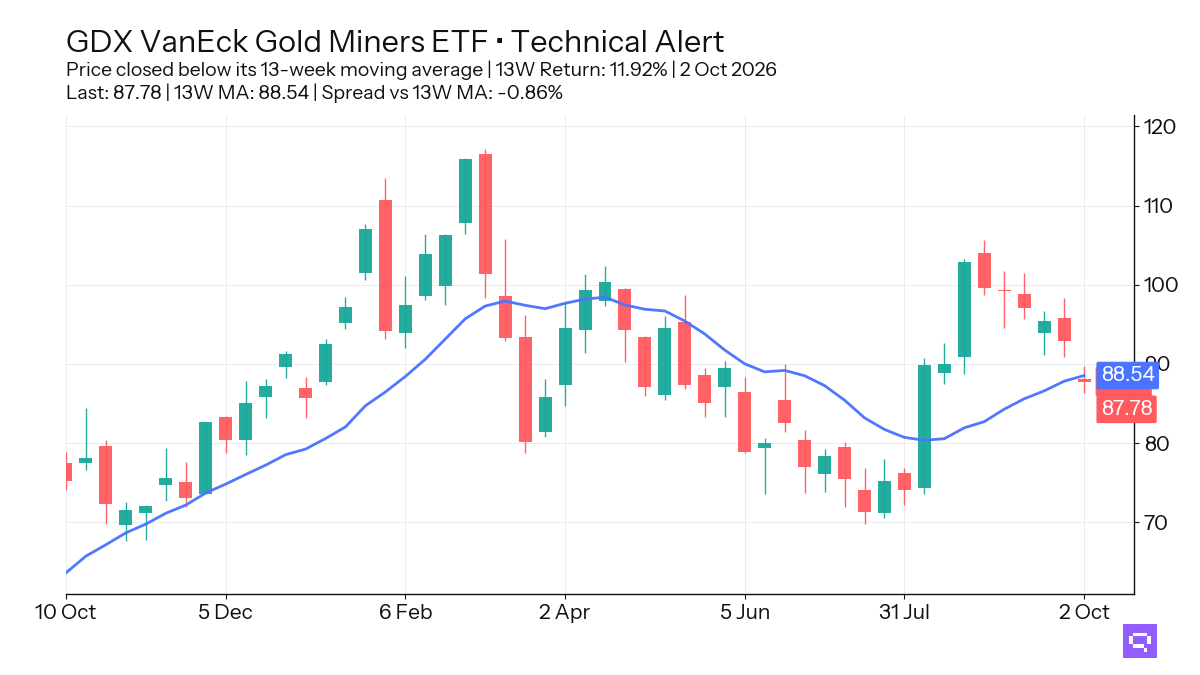
Gold Miners GDX rose 11.92% over the trailing 13-week window and crossed below its 13W MA. Its ratio vs S&P 500 SPY also crossed below its 13-week ratio MA. Gold miners join gold and clean energy on the specialty lagging side.
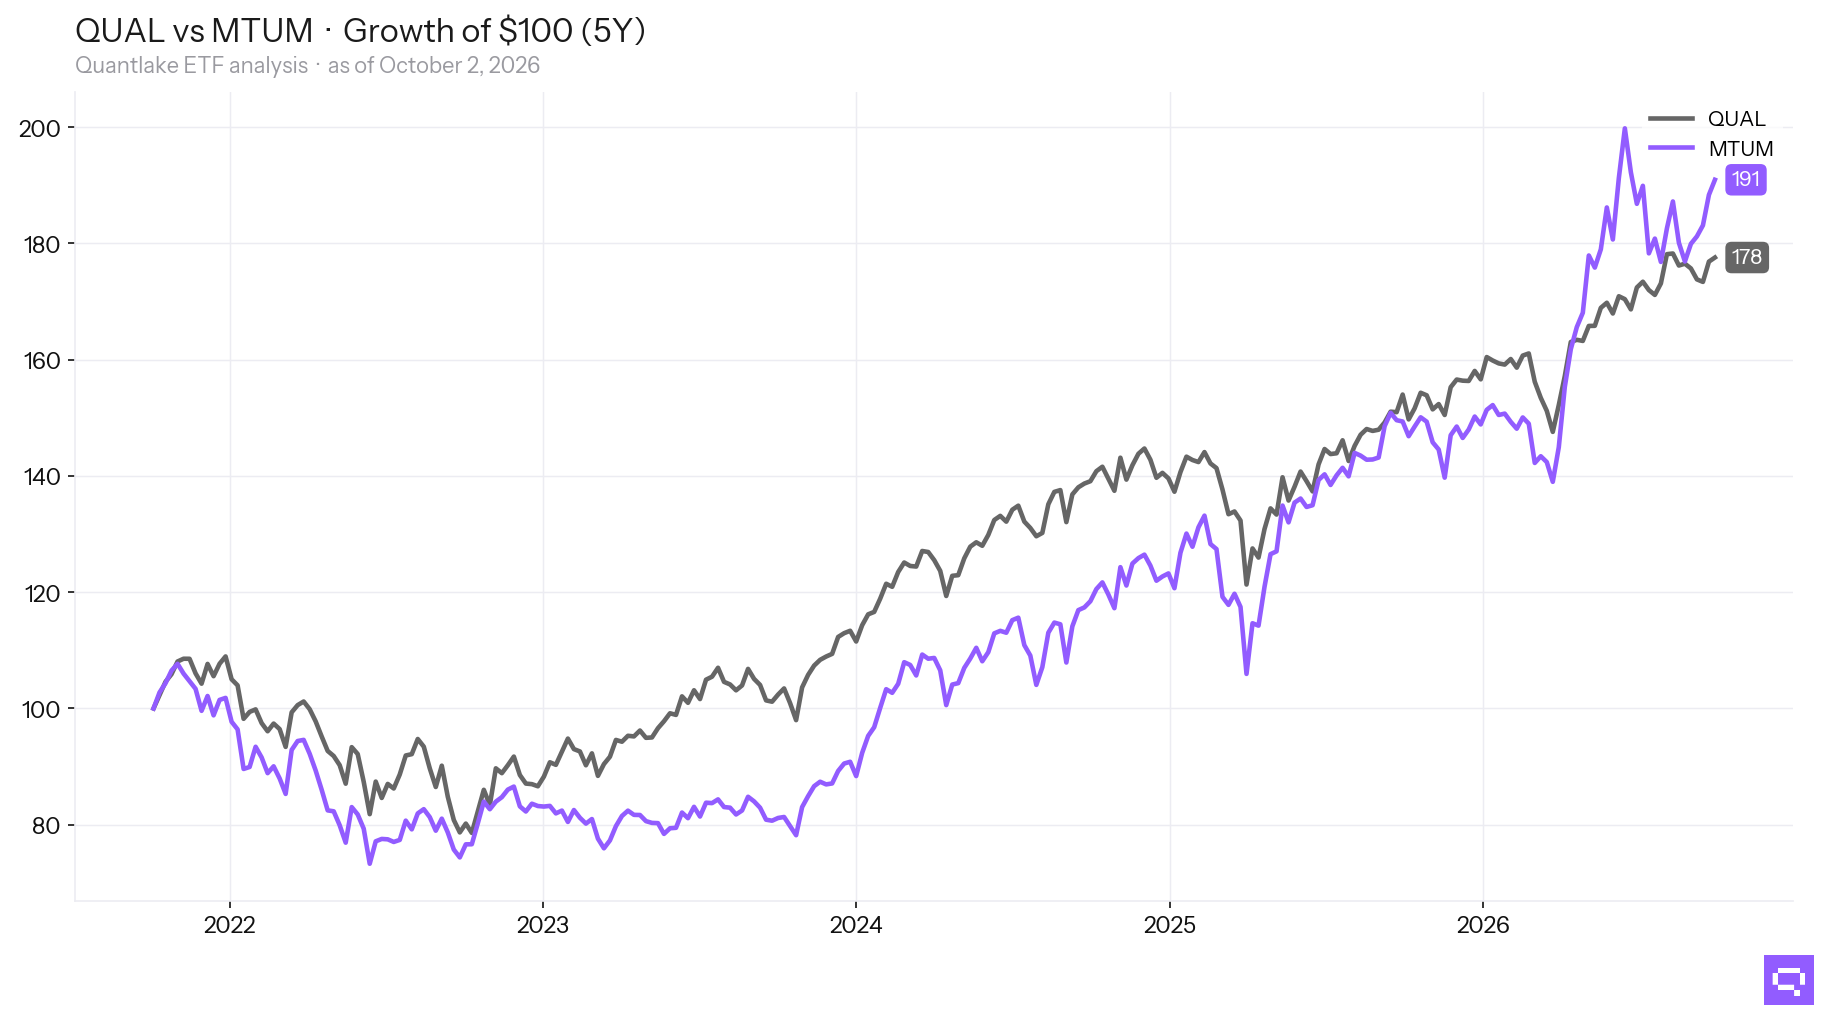
Quality Factor QUAL crossed above its 13-week ratio MA vs S&P 500 SPY after a 0.58% trailing 13-week relative decline. Value Factor VLUE, Communication Services XLC, and Healthcare XLV crossed below their ratio MA vs the benchmark.
Featured ETF: VanEck Gold Miners ETF GDX
Technical Signals
Equity: Price vs 13-week MA
| Signal | Ticker | Name | 13W perf |
|---|---|---|---|
| Cross-down | EFAV | iShares MSCI EAFE Min Vol Factor ETF | +2.2% |
| Cross-down | XLV | Health Care Select Sector | +1.9% |
| Cross-down | VWO | Vanguard FTSE Emerging Markets Index ETF | +1.1% |
| Cross-down | IMTM | iShares MSCI Intl Momentum Factor ETF | +1.0% |
| Cross-down | XLC | Communication Services Select Sector | +1.0% |
| Cross-down | JEPI | JPMorgan Equity Premium Income ETF | +0.8% |
| Cross-down | IVLU | iShares Edge MSCI Intl Value Factor ETF | +0.7% |
| Cross-down | VEA | Vanguard FTSE Developed Markets Index ETF | +0.7% |
Equity vs SPY: Price Ratio vs 13-week MA
| Signal | Ticker | Name | 13W rel perf |
|---|---|---|---|
| Cross-up | QUAL | iShares MSCI USA Quality Factor ETF | -0.6% |
| Cross-down | COPX | Global X Copper Miners ETF | +8.2% |
| Cross-down | VLUE | iShares MSCI USA Value Factor ETF | +0.6% |
| Cross-down | XLV | Health Care Select Sector | -1.7% |
| Cross-down | XLC | Communication Services Select Sector | -2.5% |
Specialty: Price vs 13-week MA
| Signal | Ticker | Name | 13W perf |
|---|---|---|---|
| Cross-down | GDX | VanEck Gold Miners ETF | +11.9% |
| Cross-down | GLD | SPDR Gold | +0.5% |
Specialty vs SPY: Price Ratio vs 13-week MA
| Signal | Ticker | Name | 13W rel perf |
|---|---|---|---|
| Cross-down | GDX | VanEck Gold Miners ETF | +8.0% |
Commodities: Price vs 13-week MA
| Signal | Ticker | Name | 13W perf |
|---|---|---|---|
| Cross-down | DBA | Invesco DB Agriculture | +5.5% |
| Cross-down | SLV | iShares Silver | -0.5% |
Commodities vs SPY: Price Ratio vs 13-week MA
| Signal | Ticker | Name | 13W rel perf |
|---|---|---|---|
| Cross-down | CPER | United States Copper LP | +2.3% |
| Cross-down | SLV | iShares Silver | -4.0% |
Related
- Tactical Trends: Asia and Growth Reclaim Ground Across Equities
- SPY candlestick signals: forward returns by pattern and sentiment
- Fear and greed: today's market sentiment reading
- ETF trend metrics explained
Romain Gandon
CEO, Quantlake
Disclaimer: This article is for informational and educational purposes only and does not constitute investment advice. Past performance is not indicative of future results.