.png)
Breadth Rebounds While ETF Leadership Narrows
SUMMARY
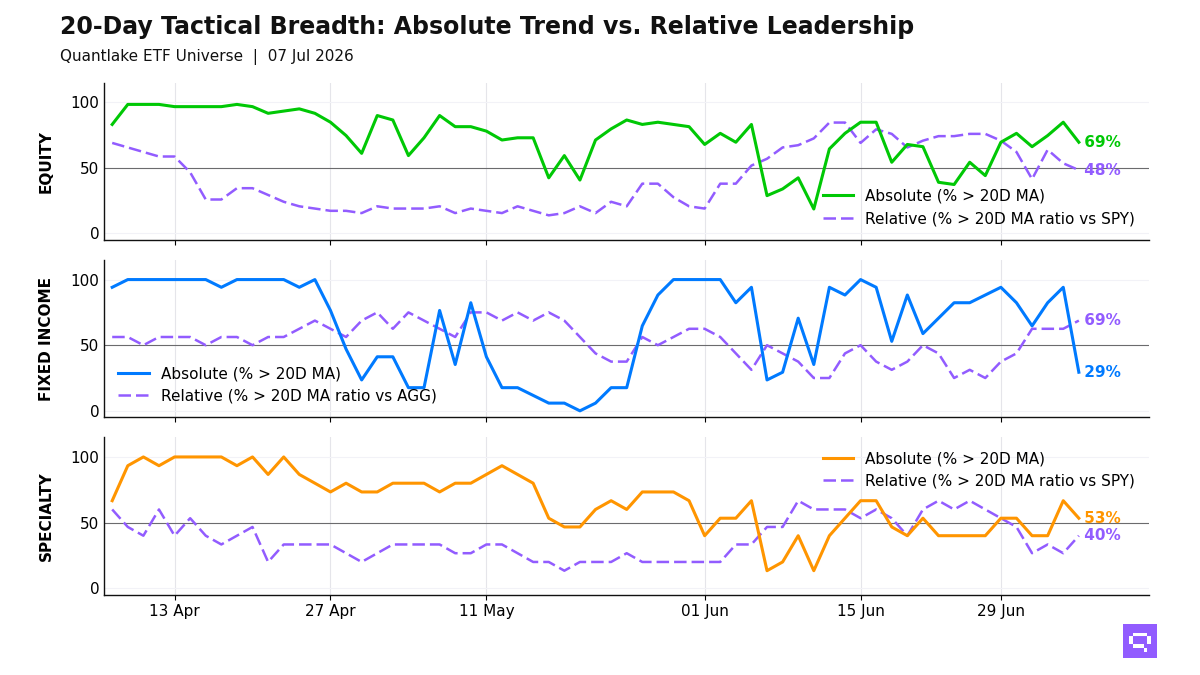
At Wednesday's close, the dominant message across Quantlake’s ETF universe was a broad recovery in absolute price participation without a matching improvement in leadership. Equity price breadth jumped to 61 of 62 ETFs, or 98%, up 17.7 points, while fixed income reached a clean 17 of 17, yet equity relative breadth slipped to 39 of 62 (63%), fixed income relative breadth eased to 9 of 17 (53%), and alternatives relative breadth collapsed to just 2 of 13 (15%), down 38.5 points. Within equity, the absolute recovery spread across growth, defensives, and several international names, but relative signals still favored selective leadership in QQQ, XLI, EWY, and VWO while dividend, value, utilities, and energy lost ground versus SPY; in fixed income, the asset class strengthened in price terms even as relative leadership stayed uneven, with BNDX improving versus AGG while TIP, VTIP, and VCSH faded. Alternatives were the clearest split: crypto and precious metals regained their 20-day moving averages in absolute terms, but USO stands out because its ratio versus SPY broke below the 20-day moving average despite a strong 20-day return, reinforcing that prior commodity leadership is cooling rather than extending; that gap between strong price breadth and weak relative breadth keeps confirmation from becoming fully convincing.
BREADTH

KEY TAKEAWAYS
- Equities led the recovery in absolute participation, but leadership narrowed toward selective growth, industrial, and international exposure rather than broad outperformance.
- Fixed income remains well supported on price, with cross-timescale confirmation in AGG, BNDX, EMB, HYG, JNK, and LQD, though relative breadth still softened at the close.
- Alternatives improved in price terms, but leadership deteriorated sharply; $USO, PDBC, DBMF, VNQ, and XLRE all point to fading relative strength despite firmer absolute readings in parts of the bucket.
BOTTOM LINE
We would read this session as a meaningful improvement in short-horizon participation, not a fully broadened leadership impulse. Until relative breadth starts to confirm the rebound—especially in alternatives and outside a narrow set of equity winners—we would keep conviction measured.
FEATURED ALERT (USO)

TECHNICAL SIGNAL EVENTS
──── EQUITY ──────
▲ Absolute Price Signals
Above 20D moving average:
XLY - Consumer Discretionary Select Sector
Last: $110.82 | 20D Return: -2.97%
XLP - Consumer Staples Select Sector
Last: $82.78 | 20D Return: -2.89%
XLC - Communication Services Select Sector
Last: $113.81 | 20D Return: -2.73%
MCHI - iShares MSCI China ETF
Last: $57.30 | 20D Return: -2.38%
XLV - Health Care Select Sector
Last: $149.67 | 20D Return: -1.87%
IWF - iShares Russell 1000 Growth ETF
Last: $443.15 | 20D Return: -1.73%
USMV - iShares MSCI USA Min Vol Factor ETF
Last: $94.12 | 20D Return: -1.47%
INDA - iShares MSCI India ETF
Last: $49.27 | 20D Return: -1.32%
FXI - iShares China Large-Cap ETF
Last: $36.35 | 20D Return: -0.66%
SDY - SPDR® S&P Dividend ETF
Last: $148.22 | 20D Return: -0.63%
QUAL - iShares MSCI USA Quality Factor ETF
Last: $199.01 | 20D Return: -0.42%
ICLN - iShares Global Clean Energy ETF
Last: $18.52 | 20D Return: +1.48%
Below 20D moving average:
XLE - Energy Select Sector
Last: $58.05 | 20D Return: +5.09%
⇄ Relative Strength Signals (vs SPY)
Above 20D moving average:
INDA - iShares MSCI India ETF
Ratio: 0.0729 | 20D Relative Return: -1.42%
SPYG - SPDR® Portfolio S&P 500 Growth ETF
Ratio: 0.1526 | 20D Relative Return: -0.56%
QQQ - Invesco QQQ
Ratio: 0.8966 | 20D Relative Return: -0.25%
XLI - Industrial Select Sector
Ratio: 0.2521 | 20D Relative Return: +0.43%
VWO - Vanguard FTSE Emerging Markets
Ratio: 0.0836 | 20D Relative Return: +1.68%
EWY - iShares MSCI South Korea ETF
Ratio: 0.2072 | 20D Relative Return: +7.39%
Below 20D moving average:
XLE - Energy Select Sector
Ratio: 0.0859 | 20D Relative Return: +4.98%
DVY - iShares Select Dividend ETF
Ratio: 0.2266 | 20D Relative Return: +1.72%
VYM - Vanguard High Dividend Yield
Ratio: 0.2250 | 20D Relative Return: +1.41%
XLU - Utilities Select Sector
Ratio: 0.0692 | 20D Relative Return: +1.07%
RSP - Invesco S&P 500® Equal Weight ETF
Ratio: 0.2928 | 20D Relative Return: +0.70%
SPYV - SPDR® Portfolio S&P 500 Value ETF
Ratio: 0.0857 | 20D Relative Return: +0.69%
VIG - Vanguard Dividend Appreciation
Ratio: 0.3283 | 20D Relative Return: +0.42%
──── FIXED INCOME ──────
▲ Absolute Price Signals
Above 20D moving average:
BNDX - Vanguard Total International Bond
Last: $48.28 | 20D Return: -0.16%
⇄ Relative Strength Signals (vs AGG)
Above 20D moving average:
TLT - iShares 20+ Year Treasury Bond ETF
Ratio: 0.8742 | 20D Relative Return: -0.81%
PFF - iShares Preferred and Income Securities ETF
Ratio: 0.3092 | 20D Relative Return: -0.51%
EMB - iShares J.P. Morgan USD Emerging Markets Bond ETF
Ratio: 0.9566 | 20D Relative Return: -0.05%
BNDX - Vanguard Total International Bond
Ratio: 0.4856 | 20D Relative Return: +0.18%
Below 20D moving average:
VTIP - Vanguard Short-Term Inflation-Protected Securities
Ratio: 0.5029 | 20D Relative Return: +0.55%
VCSH - Vanguard Short-Term Corporate Bond
Ratio: 0.7969 | 20D Relative Return: +0.25%
TIP - iShares TIPS Bond ETF
Ratio: 1.1155 | 20D Relative Return: +0.04%
MUB - iShares National Muni Bond ETF
Ratio: 1.0737 | 20D Relative Return: -0.06%
──── ALTERNATIVES ──────
▲ Absolute Price Signals
Above 20D moving average:
SLV - iShares Silver
Last: $67.47 | 20D Return: -15.76%
GLD - SPDR® Gold
Last: $434.53 | 20D Return: -9.07%
CPER - United States Copper LP
Last: $35.25 | 20D Return: -2.30%
IBIT - iShares Bitcoin
Last: $40.42 | 20D Return: +1.79%
ETHA - iShares Ethereum Trust ETF
Last: $16.72 | 20D Return: +8.57%
Below 20D moving average:
PDBC - Invesco Optimum Yield Diversified Commodity Strategy No K-1 ETF
Last: $17.01 | 20D Return: +3.47%
DBA - Invesco DB Agriculture
Last: $26.87 | 20D Return: +0.98%
DBMF - iMGP DBi Managed Futures Strategy ETF
Last: $30.18 | 20D Return: -2.04%
⇄ Relative Strength Signals (vs SPY)
Above 20D moving average:
ETHA - iShares Ethereum Trust ETF
Ratio: 0.0247 | 20D Relative Return: +8.46%
Below 20D moving average:
USO - United States Oil Fund LP
Ratio: 0.1843 | 20D Relative Return: +17.57%
PDBC - Invesco Optimum Yield Diversified Commodity Strategy No K-1 ETF
Ratio: 0.0252 | 20D Relative Return: +3.36%
FTLS - First Trust Long/Short Equity ETF
Ratio: 0.1060 | 20D Relative Return: +1.55%
XLRE - SPDR Real Estate Select ETF
Ratio: 0.0628 | 20D Relative Return: -0.55%
VNQ - Vanguard Real Estate ETF
Ratio: 0.1363 | 20D Relative Return: -0.65%
DBMF - iMGP DBi Managed Futures Strategy ETF
Ratio: 0.0446 | 20D Relative Return: -2.14%
Romain Gandon
CEO, Quantlake
Disclaimer: This report is for informational and educational purposes only and does not constitute investment advice.