.png)
The Alpha Brief: Invesco S&P 500® Equal Weight ETF (RSP)
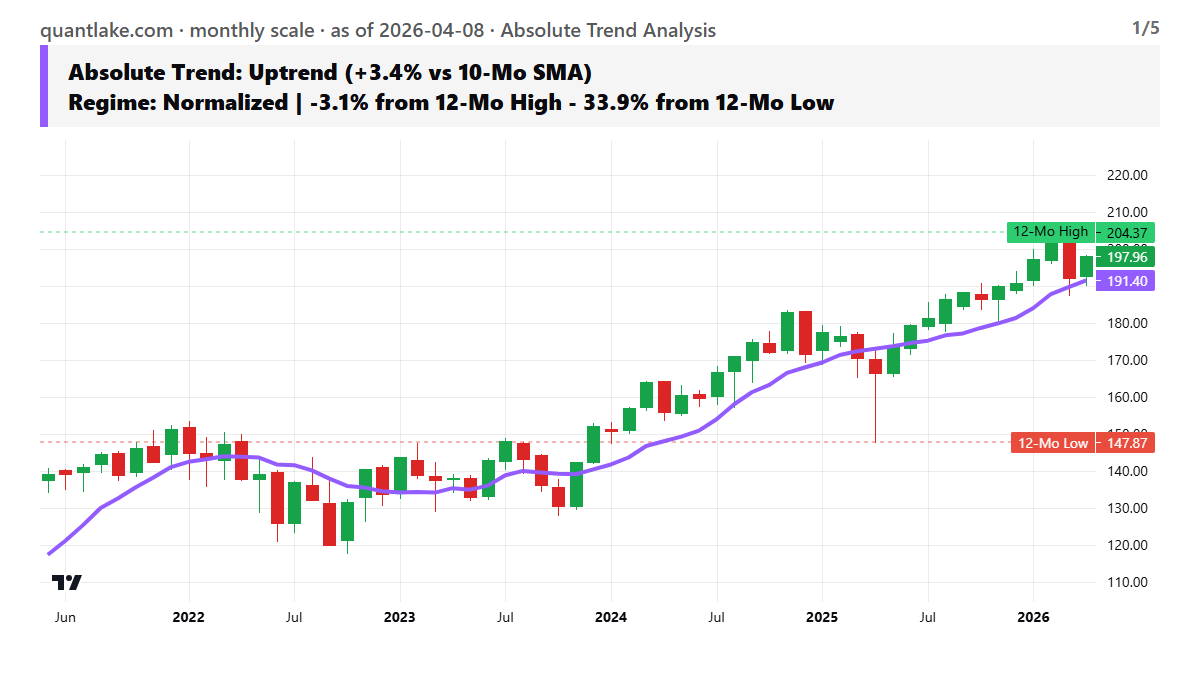
Invesco S&P 500® Equal Weight ETF closed at $197.96 on April 8th, positioned +3.4% relative to its 10-month SMA.
RSP still carries a constructive long-horizon profile, with the uptrend and relative edge intact, but the move has matured into a more selective phase rather than a fresh leg of easy broadening. Investors are now focused on whether domestic growth can keep supporting the equal-weighted, more cyclical parts of large-cap equities while a firmer rates backdrop and tariff-driven inflation risk keep valuation expansion in check.
The market first embraced broader participation in February as leadership rotated away from mega-cap technology and into value- and cycle-sensitive groups, which fits RSP’s less concentrated structure. That support was softened in March when the selloff became broad enough to hit equal-weight exposure as well, and the latest Fed communication has kept attention on inflation risk from energy and policy uncertainty rather than on a clean return to easier financial conditions. This leaves RSP behaving like a supported but constrained expression of U.S. large-cap breadth, where relative leadership can persist as long as growth holds up, but stretched efficiency and higher yields limit how quickly momentum can rebuild.
A more durable improvement needs evidence that inflation pressure tied to tariffs and energy is easing enough for rates to stop leaning against domestically exposed cyclicals. RSP would earn stronger confirmation if market breadth re-expands beyond the mega-cap complex without another month in which equal-weight participation fades when volatility rises.
Because the market is judging whether broad U.S. growth can outlast tariff and rate pressure, RSP’s absolute strength and relative leadership make sense as a breadth trade that is still working, while its normalized momentum reflects waiting for that macro validation.
Here is our 5-Lens Regime Map. 🧵👇
1️⃣ ABSOLUTE TREND: Uptrend (+3.4% vs 10-Mo SMA). The current regime is Normalized | -3.1% from 12-Mo High - 33.9% from 12-Mo Low.
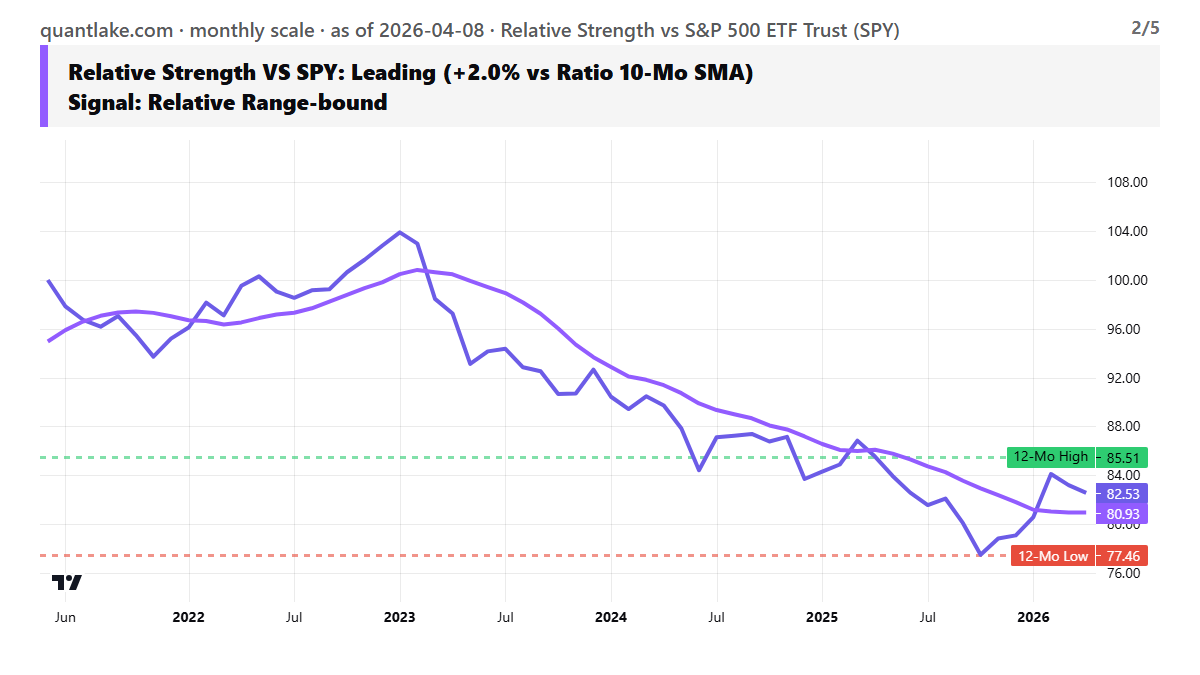
2️⃣ RELATIVE LEADERSHIP: Leading (+2.0% vs Ratio 10-Mo SMA). Signal: Relative Range-bound.
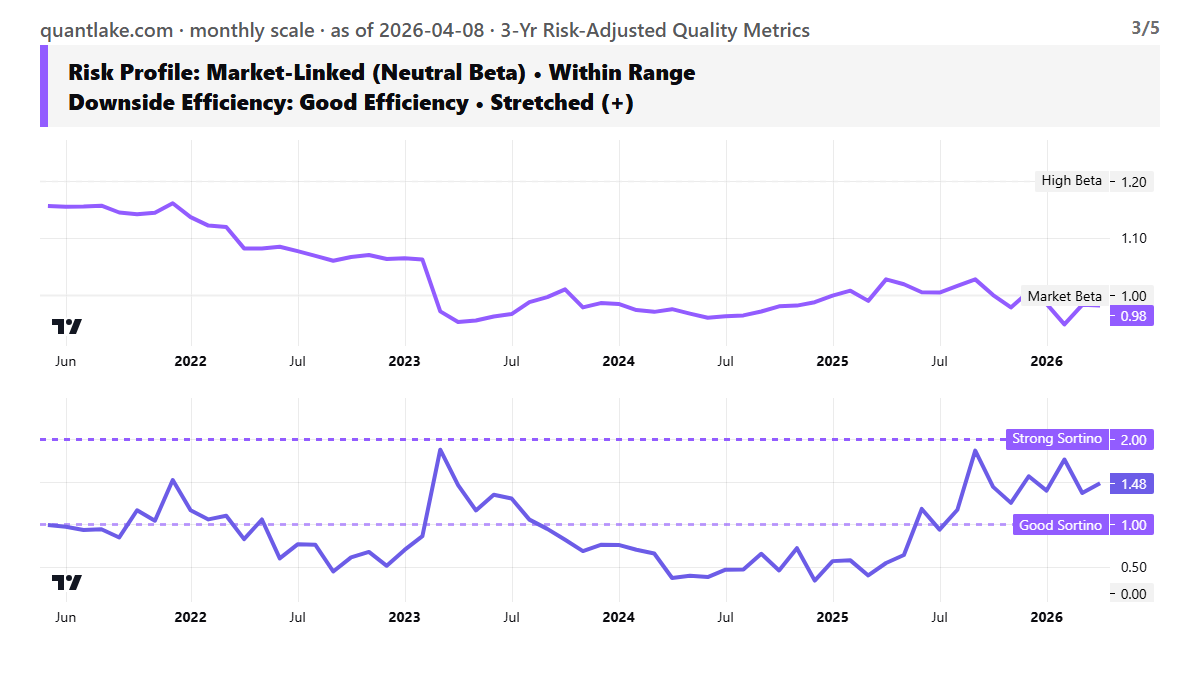
3️⃣ RISK: Market-Linked (Neutral Beta) • Within Range • Good Efficiency • Stretched (+)
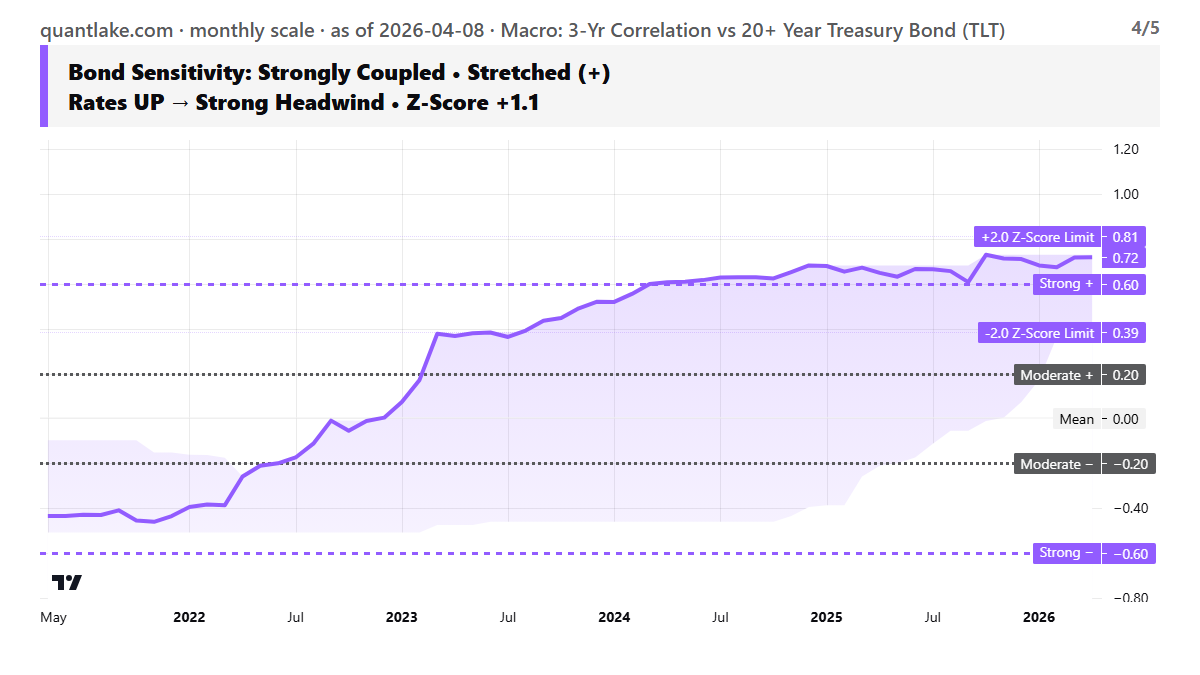
4️⃣ MACRO: Strongly Coupled • Stretched (+) • Rates UP → Strong Headwind • Z-Score +1.1
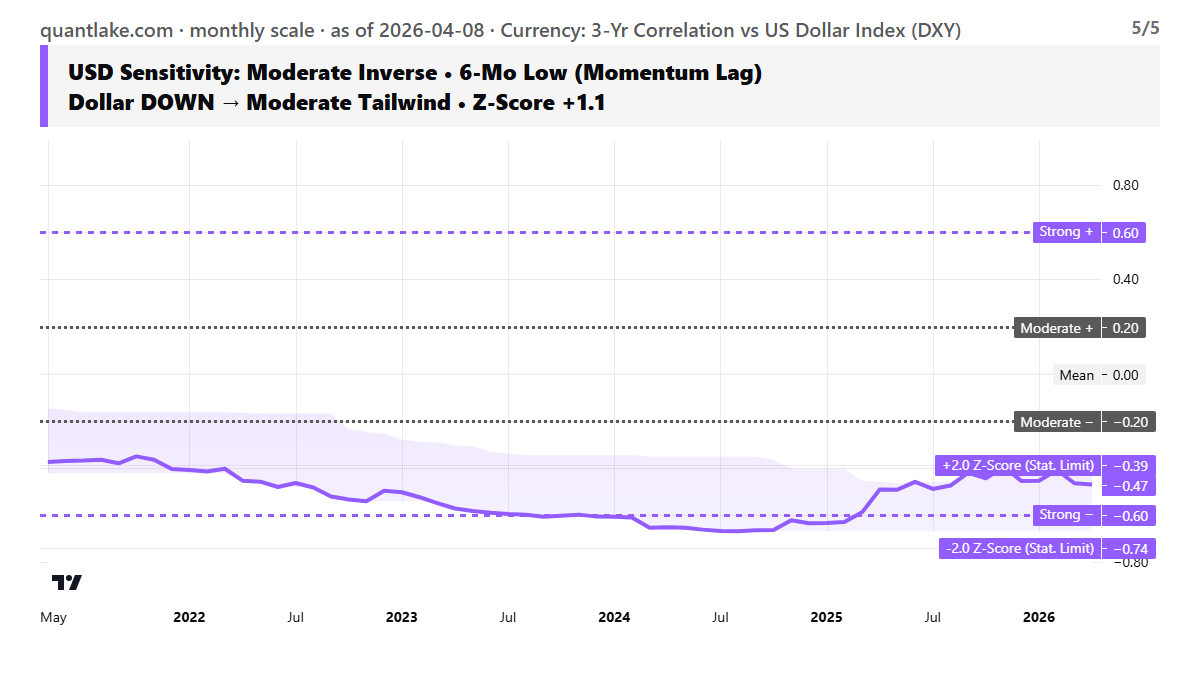
5️⃣ FX: Moderate Inverse • 6-Mo Low (Momentum Lag) • Dollar DOWN → Moderate Tailwind • Z-Score +1.1
📅 Data as of: 2026-04-08
Mean-reversion assessments are based on 3-year statistical distributions (Z-scores).
Disclaimer: Quantlake systematic analysis for informational purposes only; not financial advice.