.png)
Breadth Holds Up as ETF Leadership Thins
SUMMARY
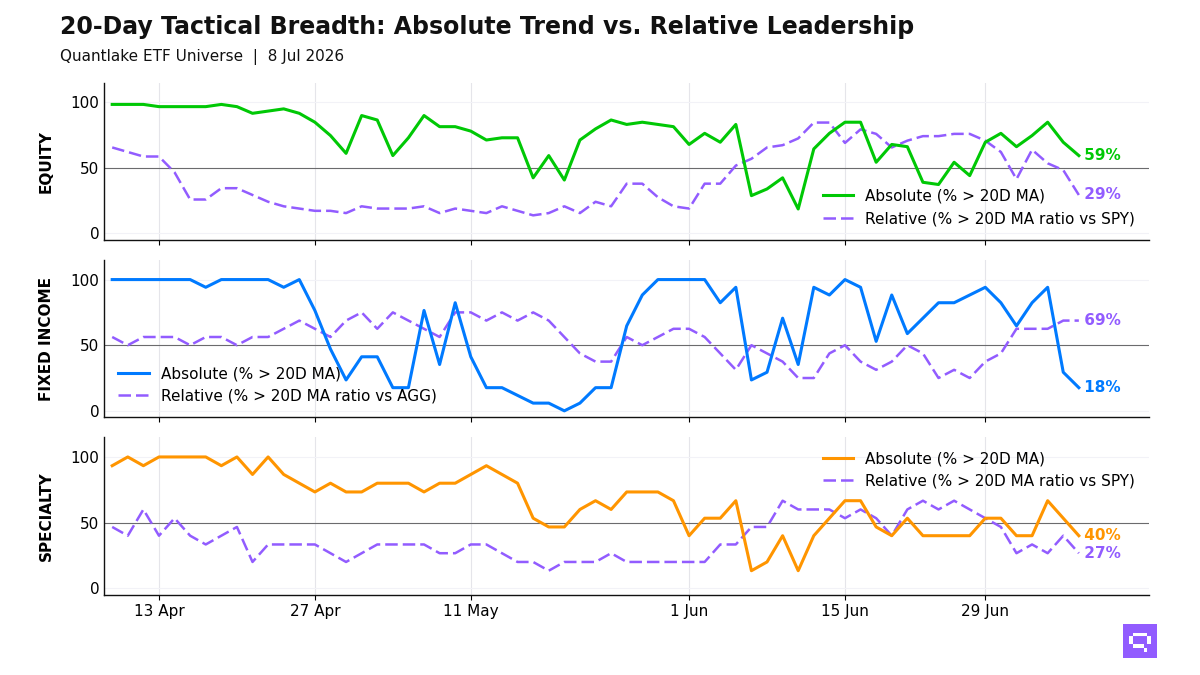
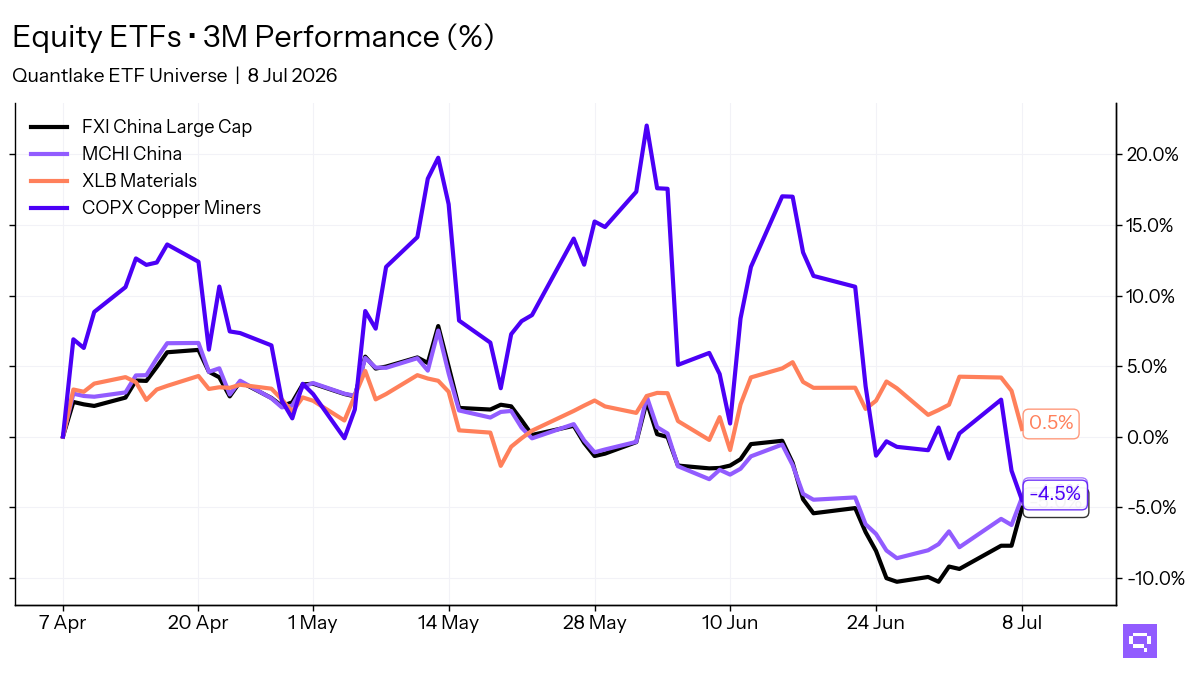
At Tuesday's close, the dominant short-horizon message was firmer absolute participation alongside fading leadership across Quantlake’s ETF universe. Equity price breadth improved to 50 of 62 ETFs, or 81%, above their 20-day moving average even as relative breadth slid to 40 of 62, or 65%, and the day’s equity alerts reflected that split with price recoveries in growth and emerging markets alongside relative slippage in quality, dividend, low-volatility, and industrial exposures; EEM’s ratio move higher versus SPY points to strengthening emerging-market leadership, while SPYG’s absolute recovery is less convincing given the broader drop in relative breadth. Fixed income strengthened on price, with 16 of 17 bond ETFs, or 94%, above their 20-day moving average after a 17.6-point jump, but relative breadth fell to 9 of 17, or 53%, as intermediate Treasuries regained their footing in absolute terms while TLT and PFF continued to lose ground versus AGG; alternatives were softer, with price breadth down to 8 of 13 and relative breadth to 7 of 13, and $ETHA is the clearest chart to watch because it broke below its 20-day moving average and also lost relative ground versus SPY despite a still-positive 20-day return, a combination that reads more like fading upside quality than durable leadership. Confirmation is limited by that widening gap between price breadth and relative breadth, while cross-timescale conviction remains selective rather than broad-based, with names such as EWY, HYG, and USO standing out more than the universe as a whole.
BREADTH

KEY TAKEAWAYS
- Equities are stabilizing on price, but leadership is narrowing as defensive and income-oriented relative lines roll over against SPY.
- Bonds improved most cleanly in absolute terms, though relative performance within fixed income still favors only select pockets rather than the group outright.
- Alternatives lost momentum on the day, and ETHA’s dual break on price and relative strength leaves crypto participation looking weaker at the close.
BOTTOM LINE
We read this session as a short-term improvement in participation, not a broad leadership reset. Until relative breadth stops deteriorating, we would treat the rebound across our monitored ETF universe as selective and favor the names with multi-horizon confirmation over simple 20-day price recoveries.
FEATURED CHART (ETHA)

TECHNICAL SIGNAL EVENTS
──── EQUITY ──────
▲ Absolute Price Signals
Above 20D moving average:
EWY - iShares MSCI South Korea ETF
Last: $127.19 | 20D Return: -5.00%
SPYG - SPDR® Portfolio S&P 500 Growth ETF
Last: $100.16 | 20D Return: -3.33%
VWO - Vanguard FTSE Emerging Markets
Last: $54.09 | 20D Return: -1.89%
Below 20D moving average:
QUAL - iShares MSCI USA Quality Factor ETF
Last: $193.39 | 20D Return: -3.44%
XLP - Consumer Staples Select Sector
Last: $81.26 | 20D Return: -4.95%
⇄ Relative Strength Signals (vs SPY)
Above 20D moving average:
EEM - iShares MSCI Emerging Markets ETF
Ratio: 0.0869 | 20D Relative Return: +0.61%
Below 20D moving average:
SCHD - Schwab U.S. Dividend Equity ETF
Ratio: 0.0464 | 20D Relative Return: +1.94%
JEPQ - JPMorgan Nasdaq Equity Premium Income ETF
Ratio: 0.0848 | 20D Relative Return: +0.66%
ACWV - iShares MSCI Global Min Vol Factor ETF
Ratio: 0.1818 | 20D Relative Return: +0.34%
JEPI - JPMorgan Equity Premium Income ETF
Ratio: 0.0857 | 20D Relative Return: +0.08%
XLI - Industrial Select Sector
Ratio: 0.2492 | 20D Relative Return: -1.11%
──── FIXED INCOME ──────
▲ Absolute Price Signals
Above 20D moving average:
IEF - iShares 7-10 Year Treasury Bond ETF
Last: $95.25 | 20D Return: -1.22%
VGIT - Vanguard Intermediate-Term Treasury
Last: $59.39 | 20D Return: -0.86%
IEI - iShares 3-7 Year Treasury Bond ETF
Last: $118.29 | 20D Return: -0.79%
⇄ Relative Strength Signals (vs AGG)
Below 20D moving average:
PFF - iShares Preferred and Income Securities ETF
Ratio: 0.3073 | 20D Relative Return: -0.87%
TLT - iShares 20+ Year Treasury Bond ETF
Ratio: 0.8737 | 20D Relative Return: -1.60%
──── ALTERNATIVES ──────
▲ Absolute Price Signals
Below 20D moving average:
ETHA - iShares Ethereum Trust ETF
Last: $15.95 | 20D Return: +3.77%
⇄ Relative Strength Signals (vs SPY)
Above 20D moving average:
REET - iShares Global REIT ETF
Ratio: 0.0389 | 20D Relative Return: +0.26%
FXE - Invesco CurrencyShares® Euro Currency
Ratio: 0.1623 | 20D Relative Return: +2.58%
Below 20D moving average:
ETHA - iShares Ethereum Trust ETF
Ratio: 0.0242 | 20D Relative Return: +6.48%
DBA - Invesco DB Agriculture
Ratio: 0.0410 | 20D Relative Return: +4.39%
UUP - Invesco DB US Dollar Index Bullish
Ratio: 0.0421 | 20D Relative Return: +3.69%