.png)
Monday Close: Growth and Broad Risk Reassert Themselves
SUMMARY
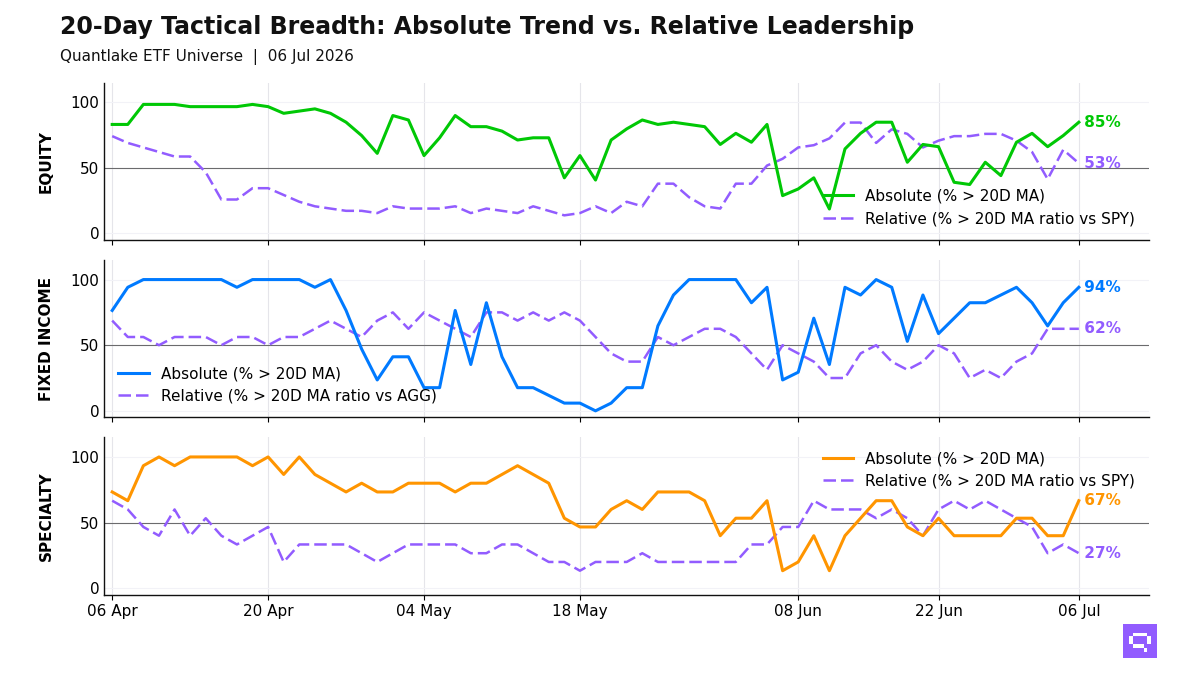
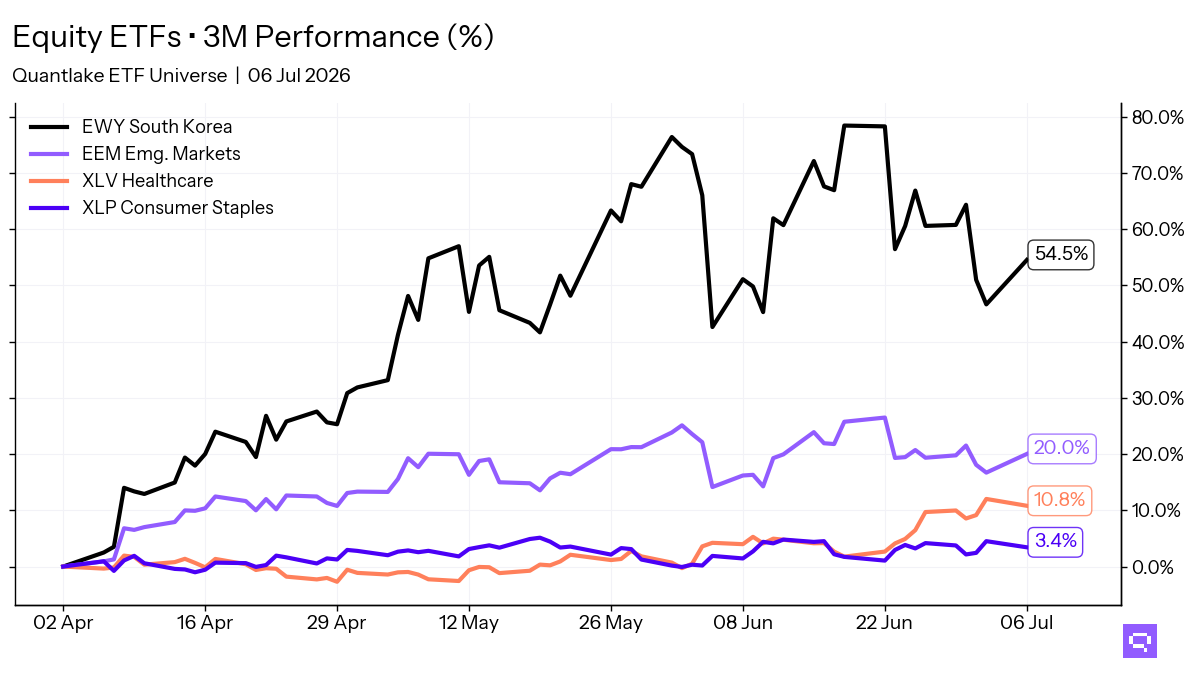
At Monday's close, our ETF universe showed a clear recovery bias, with broad equity ETFs and growth-heavy exposures pushing back above their 20-day moving averages. That improvement was most visible in U.S. beta and technology-linked names, while emerging markets and selected income vehicles also joined the rebound on an absolute basis. Relative leadership was more selective: technology improved cleanly against SPY, but several defensive equity relationships continued to fade, and much of fixed income leadership versus AGG still looks more like rotation within bonds than a decisive risk signal. With many absolute cross-ups coming after weak 20-day returns, the advance looks real but still early rather than deeply established.
KEY TAKEAWAYS
- Broad equity participation improved at Monday's close, led by VTI, QQQ, XLK, IYW and supported by XLI, QUAL and EEM on an absolute basis.
- Relative strength within equities still favors growth over defense, with technology strengthening against SPY while low vol, dividend and REIT exposure lose ground.
- Bond-relative moves broadened toward TIPS, floating-rate and cash-like duration, though several of those ratios are stabilizing from weak 20-day returns rather than signaling clear leadership.
BOTTOM LINE
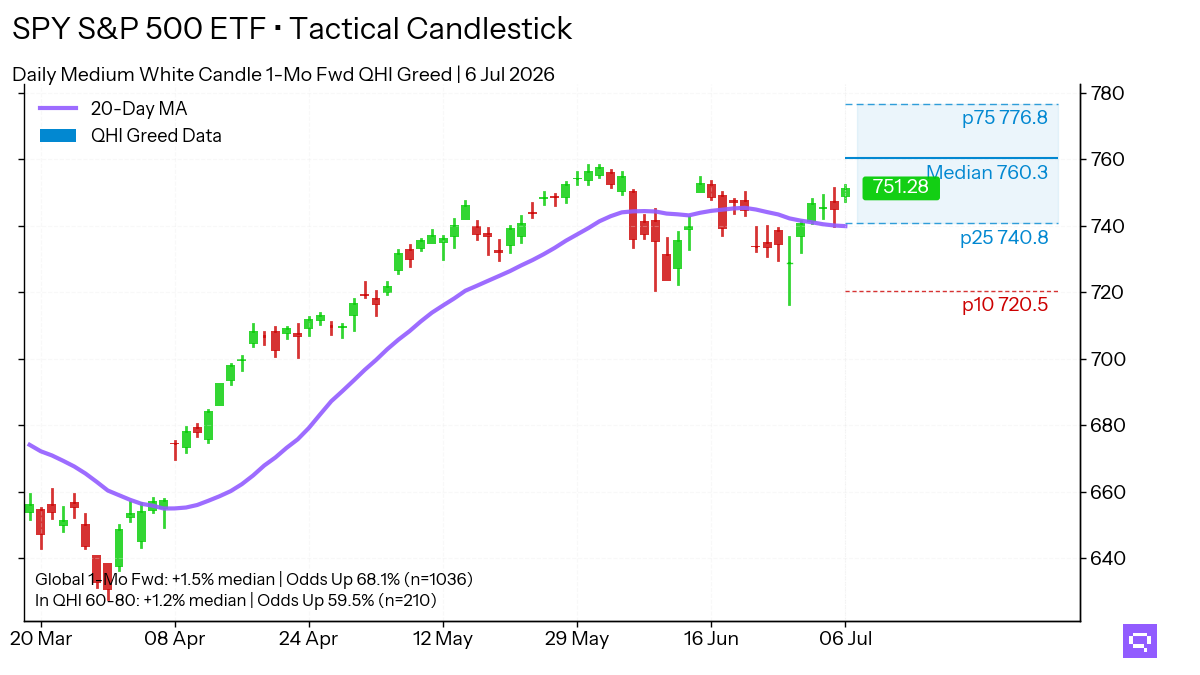
We read Monday's close as a constructive short-term turn for risk assets, especially in technology and broad U.S. equity exposure. Still, confirmation is stronger in absolute price than in cross-ETF leadership, so conviction improves only if relative strength broadens beyond a narrow growth-led rebound.
TECHNICAL SIGNAL EVENTS
ABSOLUTE PRICE SIGNALS
Above 20D moving average:
EEM - iShares MSCI Emerging Markets ETF
Last: $57.11 | 20D Return: -0.37%
EMB - iShares J.P. Morgan USD Emerging Markets Bond ETF
Last: $93.94 | 20D Return: -1.41%
EWT - iShares MSCI Taiwan ETF
Last: $71.29 | 20D Return: +2.55%
IYW - iShares U.S. Technology ETF
Last: $186.55 | 20D Return: -0.91%
JEPI - JPMorgan Equity Premium Income ETF
Last: $56.70 | 20D Return: -1.66%
JEPQ - JPMorgan Nasdaq Equity Premium Income ETF
Last: $55.92 | 20D Return: -0.64%
PFF - iShares Preferred and Income Securities ETF
Last: $30.50 | 20D Return: -1.53%
QQQ - Invesco QQQ
Last: $588.50 | 20D Return: -1.75%
QUAL - iShares MSCI USA Quality Factor ETF
Last: $194.03 | 20D Return: -2.12%
VTI - Vanguard Total Stock Market
Last: $325.21 | 20D Return: -1.56%
XLI - Industrial Select Sector
Last: $164.61 | 20D Return: -2.86%
XLK - Technology Select Sector
Last: $136.78 | 20D Return: -0.25%
XLP - Consumer Staples Select Sector
Last: $82.66 | 20D Return: -3.09%

Below 20D moving average:
VGSH - Vanguard Short-Term Treasury
Last: $58.32 | 20D Return: -0.28%
RELATIVE STRENGTH SIGNALS
Above 20D moving average:
IYW / SPY - iShares U.S. Technology ETF
Ratio: 0.2831 | 20D Relative Return: +0.83%
MUB / AGG - iShares National Muni Bond ETF
Ratio: 1.0747 | 20D Relative Return: -0.03%
PFF / AGG - iShares Preferred and Income Securities ETF
Ratio: 0.3079 | 20D Relative Return: -0.81%
SGOV / AGG - iShares
Ratio: 1.0140 | 20D Relative Return: +1.02%
TIP / AGG - iShares TIPS Bond ETF
Ratio: 1.1182 | 20D Relative Return: +0.13%
TLT / AGG - iShares 20+ Year Treasury Bond ETF
Ratio: 0.8748 | 20D Relative Return: -0.93%
USFR / AGG - WisdomTree Floating Rate Treasury
Ratio: 0.5084 | 20D Relative Return: +0.99%
VTIP / AGG - Vanguard Short-Term Inflation-Protected Securities
Ratio: 0.5047 | 20D Relative Return: +0.78%
XLI / SPY - Industrial Select Sector
Ratio: 0.2498 | 20D Relative Return: -1.15%
Below 20D moving average:
CPER / SPY - United States Copper LP
Ratio: 0.0521 | 20D Relative Return: -2.04%
REET / SPY - iShares Global REIT ETF
Ratio: 0.0388 | 20D Relative Return: -0.72%
SDY / SPY - SPDR® S&P Dividend ETF
Ratio: 0.2220 | 20D Relative Return: -1.10%
USMV / SPY - iShares MSCI USA Min Vol Factor ETF
Ratio: 0.1418 | 20D Relative Return: -1.23%