.png)
S&P 500 Sectors Are Compressing — Where Leadership Stands
Low-dispersion tape with narrow sector separation; Technology remains the confirmed leader.
US equity sector dispersion remains subdued across the 11 S&P 500 sector ETFs. Cross-sectional separation is narrow, and sector breadth is present but compressed. The backdrop is a low-dispersion, higher-correlation regime in which beta-hugging behavior dominates and relative performance spreads are harder to sustain.
Within that regime, Technology remains the confirmed leader. Its 5-day relative strength is positive, and 20-day relative strength remains the strongest in the group. The sector holds clear leadership. Health Care also holds a positive profile. Technology retains the clearer structural advantage.
Real Estate shows the clearest rotation. Its 5-day relative strength is firmly positive, while 20-day relative strength remains near flat. The sector is a secondary participant. Utilities show a similar pattern. Communication Services remains the clearest laggard.
Overall, market positioning is broadly constructive but tightly clustered. Leadership is present, yet compressed dispersion limits its reach.
Sector Rotation Map
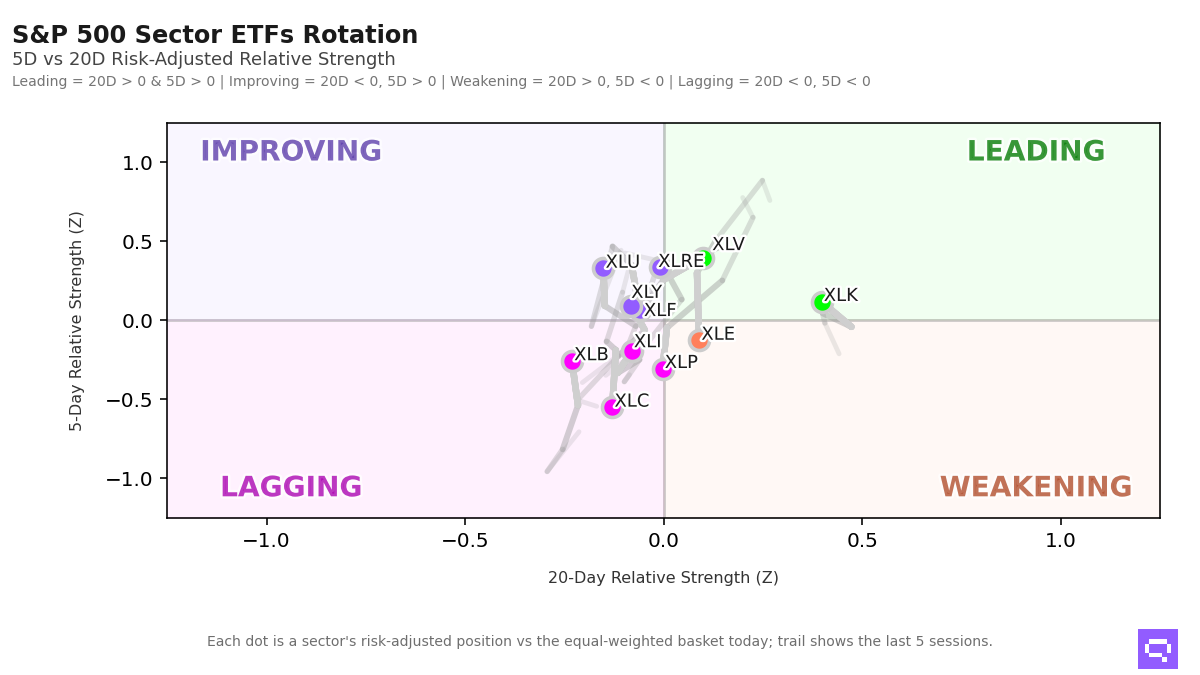
Alpha Z: risk-adjusted relative strength vs the equal-weighted S&P 500 sector basket (Z-score). Velocity: rate of change in short-term relative strength (1D vs 5D Z-score delta — tactical momentum). Structural velocity: smoothed 5D vs 20D momentum delta, reflecting regime-level directional shifts.
Momentum Leaders
• Technology — Rank #2 | Alpha Z: +0.35 | Velocity: +0.23
• Health Care — Rank #1 | Alpha Z: +0.77 | Velocity: +0.37
Rotation Warnings
• Consumer Staples — Rank shift (1D vs 5D): +1 | Structural velocity: -0.30
Mean Reversion Candidates
• Materials — Alpha Z: +0.04 | Velocity: +0.30
Romain Gandon
CEO, Quantlake
Disclaimer: This article is for informational and educational purposes only and does not constitute investment advice. Past performance is not indicative of future results.