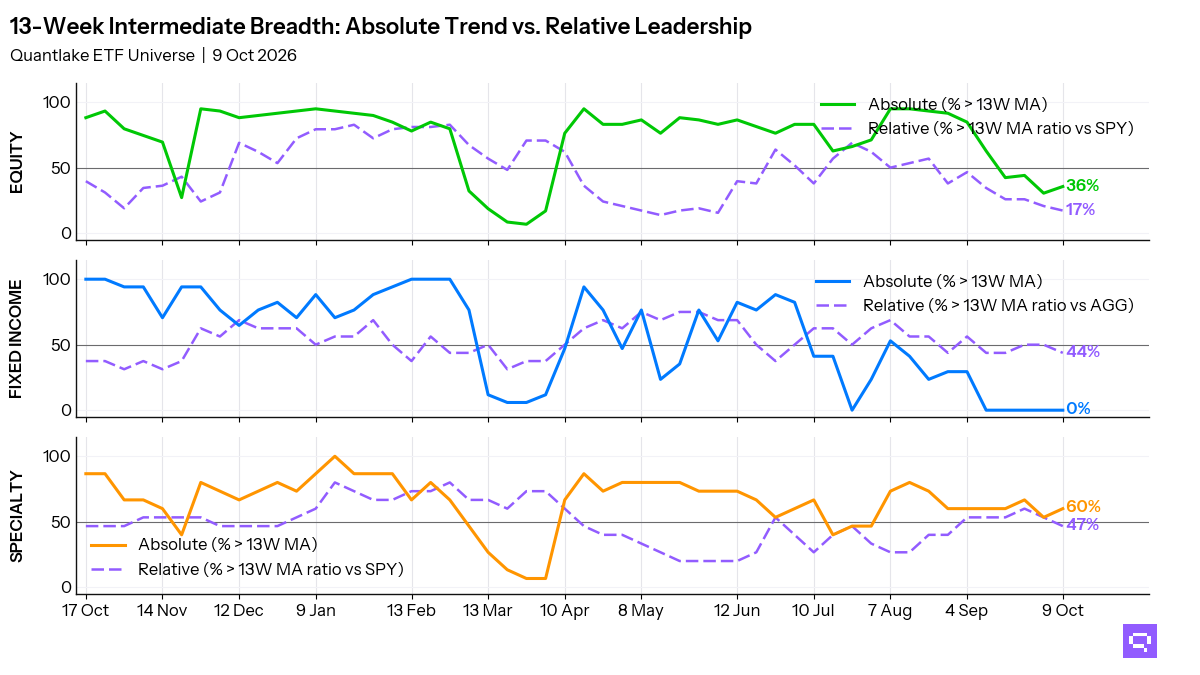
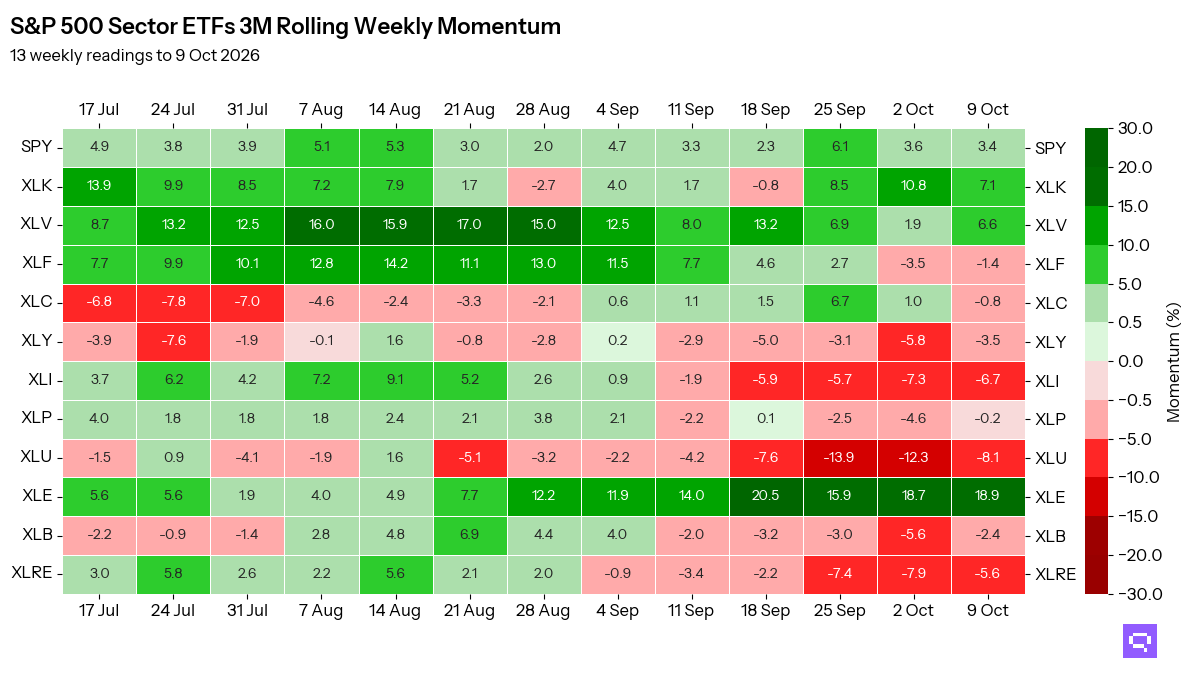
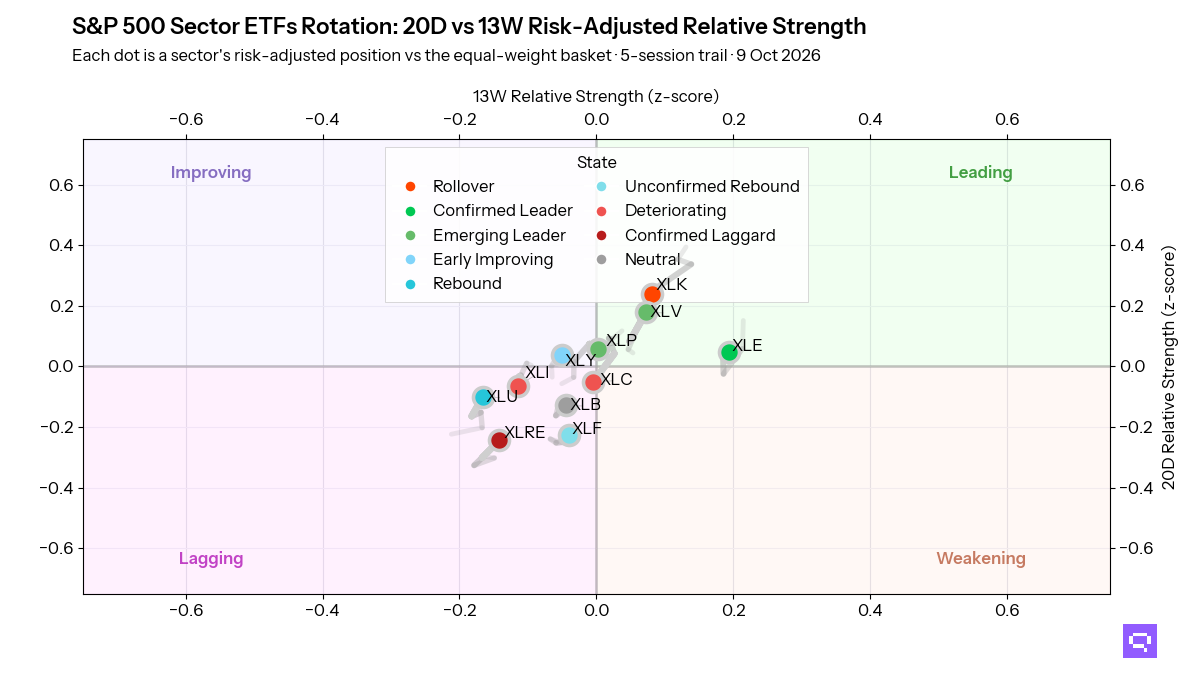
.png)

Tactical Trends: US Growth Carries as Equity Leadership Narrows
Price participation held, yet the benchmark pulled further ahead
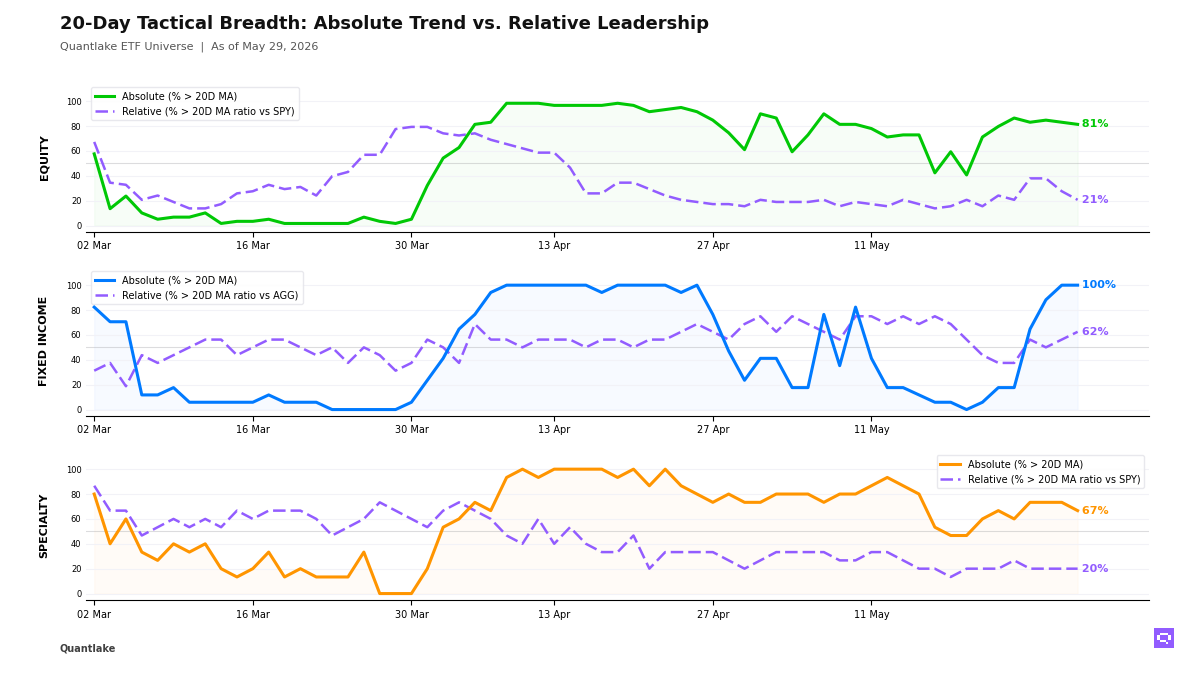
At the close, the equity tape across our ETF universe was benchmark-led. 48 of 59 ETFs (81%, -1.7pp) held above their 20-day moving average, but only 12 of 58 (21%, -6.9pp) outperformed the S&P 500 SPY, leaving a +61pp gap. Leadership stayed concentrated in US growth, technology, emerging markets and select Asia, while low-volatility, dividend and developed ex-US exposures failed to confirm. That is a narrow equity advance across our coverage.
Fixed income strengthened more cleanly. All 17 bond ETFs (100%, unchanged on the day) held above their 20-day moving average, and 10 of 16 (62%, +6.2pp) outperformed the Aggregate Bonds AGG, leaving a +38pp gap. Credit, EM debt, preferreds and long duration led the benchmark, while Treasuries, inflation-linked debt and short-duration lagged. That is broad confirmation in bonds, with leadership coming from spread product and rate sensitivity rather than cash-like stability.
Specialty weakened in price without gaining relative leadership. 10 of 15 ETFs (67%, -6.7pp) held above their 20-day moving average, yet only 3 of 15 (20%, unchanged on the day) outperformed the S&P 500 SPY, leaving a +47pp gap as semiconductors, momentum and clean energy carried the relative leaders and real estate plus crypto-linked exposures lost price support. Commodities produced no fresh confirmed daily crosses, though copper remained the only cross-timescale absolute leader in our coverage and broad commodities still lagged on a relative basis. The cross-asset picture stayed selective rather than broadening.
20-Day Tactical Breadth
Key Takeaways
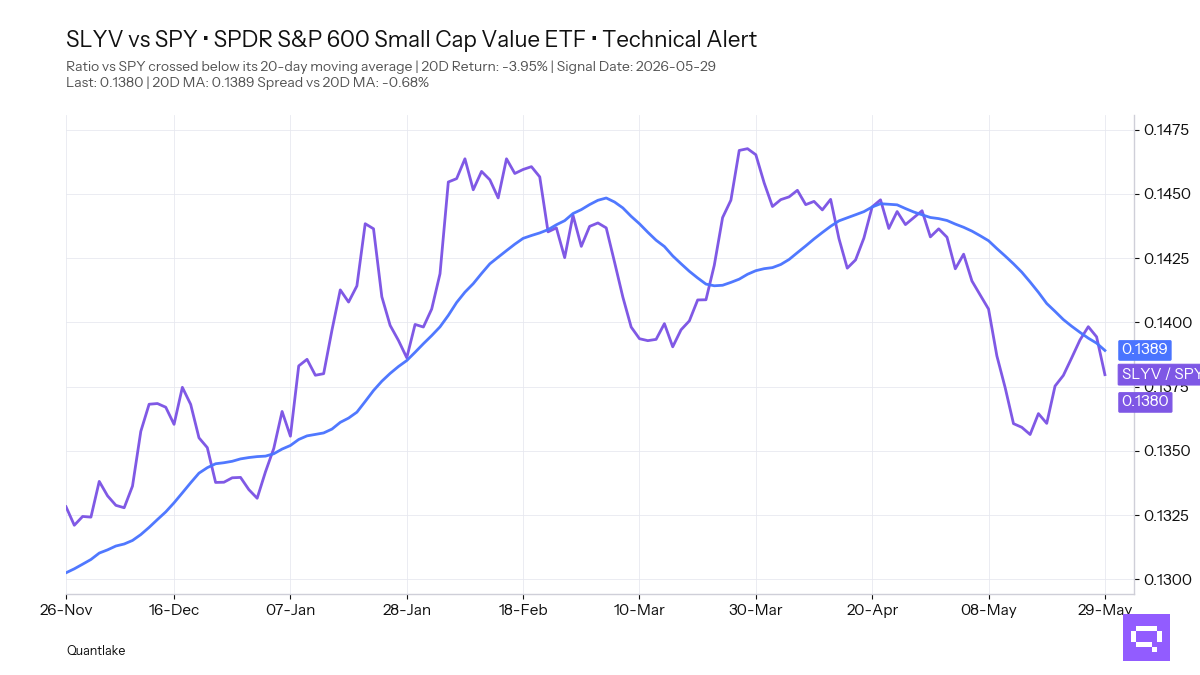
• S&P SmallCap Value SLYV with a -3.95% period relative return versus SPY crossed below its 20-day ratio moving average. Small-Cap VB also crossed below its 20-day ratio moving average versus SPY with a -1.95% period relative return. Healthcare XLV and Consumer Discretionary XLY joined the same relative weakening cluster versus the benchmark. That leaves size and value on the losing side of the current equity split.
• Preferred Stock PFF crossed above its 20-day ratio moving average versus AGG with a +0.50% period relative return. Across timescales, bond leadership still sits in credit, EM debt, international aggregate, and long duration. Treasuries, TIPS, and short-duration remain the relative laggards versus the benchmark. The bond structure is broad. It is not led by cash-proxy stability.
• Gold Miners GDX crossed above its 20-day moving average with a +1.36% 20-day return. Global REITs REET and Real Estate VNQ crossed below their 20-day moving averages. Commodities still lacked fresh daily confirmation, with copper holding the only cross-timescale absolute leader in our coverage and broad commodities staying on the relative lagging side. Hard-asset participation is selective, with mining recovering as real estate rolls over.
FEATURED ETF — SPDR® S&P 600 Small Cap Value ETF SLYV vs SPY
Other Technical Signal Events
EQUITY
↗ Price breakouts (cross-up 20D MA)
• XLF - Financial Select Sector · 20D perf: -1.06%
↘ Price breakdowns (cross-down 20D MA)
• XLC - Communication Services Select Sector · 20D perf: -0.70%
• XLRE - SPDR Real Estate Select ETF · -0.92%
↗ Leadership gains (cross-up 20D MA vs SPY)
None on the close
↘ Leadership losses (cross-down 20D MA vs SPY)
• VB - Vanguard Small-Cap · 20D relative perf: -1.95%
• XLV - Health Care Select Sector · -2.73%
• XLY - Consumer Discretionary Select Sector · -2.98%
• SLYV - SPDR® S&P 600 Small Cap Value ETF · -3.95%
FIXED INCOME
↗ Price breakouts (cross-up 20D MA)
None on the close
↘ Price breakdowns (cross-down 20D MA)
None on the close
↗ Leadership gains (cross-up 20D MA vs AGG)
• PFF - iShares Preferred and Income Securities ETF · 20D relative perf: +0.50%
↘ Leadership losses (cross-down 20D MA vs AGG)
None on the close
SPECIALTY
↗ Price breakouts (cross-up 20D MA)
• GDX - VanEck Gold Miners ETF · 20D perf: +1.36%
↘ Price breakdowns (cross-down 20D MA)
• REET - iShares Global REIT ETF · 20D perf: -0.18%
• VNQ - Vanguard Real Estate ETF · -0.65%
↗ Leadership gains (cross-up 20D MA vs SPY)
None on the close
↘ Leadership losses (cross-down 20D MA vs SPY)
None on the close
COMMODITIES
No event on the close
Romain Gandon
CEO, Quantlake
Disclaimer: This article is for informational and educational purposes only and does not constitute investment advice. Past performance is not indicative of future results.