Technology XLK led the week's sharpest downside rotation and Consumer Staples XLP topped standings.
Dispersion across the eleven S&P 500 sector ETFs is in a normal regime as of October 9, with a z-score of -0.12. Sector returns are close to their recent norm. The spread widened markedly over the past five sessions, and the widening is recent.
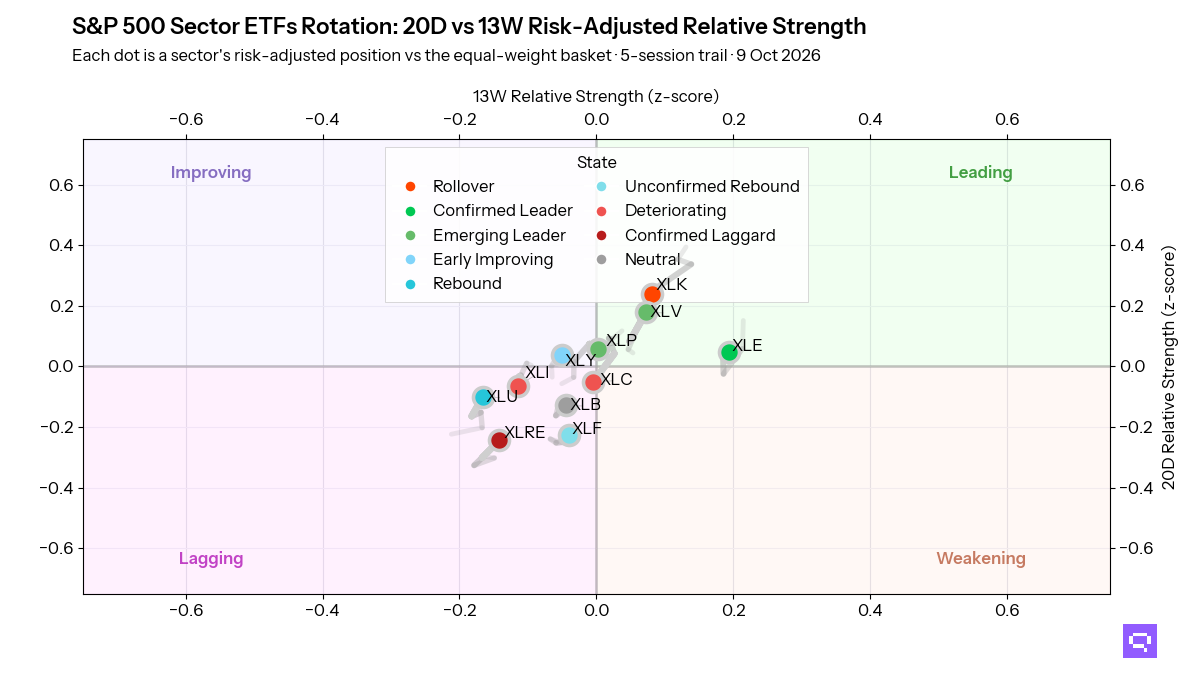
Healthcare XLV posted the strongest upside rotation in the field and ranks fourth, positive on both horizons. Consumer Staples XLP also rotated higher and tops the weekly standings at +0.41; it is positive on both horizons with near-zero intermediate backing. Consumer Discretionary XLY strengthened into fifth from an improving base. Utilities XLU and Financials XLF rebounded from lagging positions to second and sixth. Energy XLE rolled lower inside the Leading quadrant and ranks third, positive on both horizons.
Technology XLK posted the week's sharpest downside rotation, rolled over inside the Leading quadrant, and fell nine places to tenth. Industrials XLI followed with another sharp decline and ranks last at -0.52, with both the 20-day and 13-week readings negative. Communication Services XLC deteriorated to ninth within the Lagging quadrant. Real Estate XLRE barely moved and ranks seventh with both horizons negative, and Materials XLB firmed to eighth from a neutral lagging position. Positive leadership states total four of the eleven sectors.
Sector Rotation Map
How to read this report
The readings
13W, 20D, 5D: each day we compare a sector's return with the average return of the 11 sectors, each counted equally. The S&P 500 weights them by size, so the two can differ. We divide that gap by how much the sector usually moves in a day (its daily swings over the last 20 sessions), so a quiet sector and a volatile one are measured on the same scale. Each reading averages these daily scores over its window: 13W over the last 13 weeks (about a quarter), 20D over the last 20 sessions (about a month), 5D over this week. +0.50 means that on a typical day the sector beat the average by half its usual daily move; 0 means it matched the average.
In the text
Dispersion regime: how far apart the 11 sectors' returns were on the latest day (the spread of their daily returns), compared with that spread's average over the last 60 sessions. The z-score is the distance from that average, in units of the spread's usual variation (estimated with a GARCH model, which widens the unit when markets turn volatile). High-dispersion (+2 or more) and elevated (+1 to +2): sectors moving further apart than usual. Normal: -1 to +1. Transitional-low (-1 to -2) and low-dispersion (-2 or less): sectors moving more closely together than usual.
Ranks are this week's standings, by 5D. The quadrant (see On the chart) uses 13W and 20D, so a sector can rank near the top this week and still sit in Lagging.
On the chart
Quadrant: does 20D agree with 13W? The chart plots 13W across and 20D up. Leading: beat the average on 13W and is still beating it on 20D. Improving: trailed on 13W, but has beaten the average on 20D. Weakening: beat the average on 13W, but has trailed it on 20D. Lagging: trailed on 13W and is still trailing on 20D. In Improving and Weakening, 20D goes against the 13W trend. A reading near zero means a sector close to the average, whatever its quadrant.
Trails and dots: each sector's path over the last 5 sessions. The dot marks the latest session, coloured by its state (defined under the table).
Sector Leadership Matrix
Sector
13W Z
20D Z
5D Z
Velocity
Quadrant
State
Energy (XLE)
+0.19
+0.05
+0.24
-0.08
Leading
Confirmed Leader
Technology (XLK)
+0.08
+0.24
-0.42
-0.20
Leading
Rollover
Healthcare (XLV)
+0.07
+0.18
+0.19
+0.16
Leading
Emerging Leader
Consumer Staples (XLP)
+0.00
+0.06
+0.41
+0.13
Leading
Emerging Leader
Communication Services (XLC)
-0.01
-0.05
-0.27
-0.12
Lagging
Deteriorating
Financials (XLF)
-0.04
-0.23
+0.09
+0.06
Lagging
Unconfirmed Rebound
Materials (XLB)
-0.04
-0.13
-0.16
+0.04
Lagging
Neutral
Consumer Discretionary (XLY)
-0.05
+0.04
+0.14
+0.10
Improving
Early Improving
Industrials (XLI)
-0.11
-0.06
-0.52
-0.16
Lagging
Deteriorating
Real Estate (XLRE)
-0.14
-0.24
-0.07
-0.01
Lagging
Confirmed Laggard
Utilities (XLU)
-0.17
-0.10
+0.34
+0.07
Lagging
Rebound
How to read this table
13W Z, 20D Z, 5D Z: the readings defined above; the table is sorted by 13W Z, strongest first.
Velocity: how much 20D changed this week; positive is rising, negative is falling. It is the vertical part of the sector's trail on the chart.
State: the quadrant refined by how 13W and 20D moved this week.
Rollover: Beat the sector average on 13W, but both 13W and 20D fell this week, 20D by more than 0.10.
Confirmed Leader: Beat the sector average on 13W and 20D, and is one of the two strongest on 13W.
Emerging Leader: Beat the sector average on 13W and 20D, outside the two strongest on 13W.
Early Improving: Trailed on 13W and beat the average on 20D, by 0.20 or less (and at most 0.50 on 5D), or with 13W falling this week.
Rebound: Trailed on 13W and 20D, but 20D rose more than 0.05 this week and 13W did not fall.
Unconfirmed Rebound: Trailed on 13W and 20D; 20D rose more than 0.05 this week while 13W kept falling.
Deteriorating: Trailed on 13W and 20D, and 20D fell more than 0.05 this week.
Confirmed Laggard: Trailed on 13W and 20D, among the four weakest on 13W, with little change this week.
Neutral: Trailed on 13W and 20D, outside the four weakest on 13W, with little change this week.
Romain Gandon CEO, Quantlake
Disclaimer: This article is for informational and educational purposes only and does not constitute investment advice. Past performance is not indicative of future results.
Share this article
Join our Community of Smarter Investors
Thank you! You're all set!
Oops! Something went wrong while submitting the form.
We use cookies to enhance your browsing experience, provide personalized content and ads, and analyze our traffic. By clicking "Accept All", you consent to our use of cookies.Cookie Policy
We use cookies to enhance your browsing experience, provide personalized content and ads, and analyze our traffic. By clicking "Accept All", you consent to our use of cookies.Cookie Policy


.png)