.png)

Sector Momentum: Three of 11 Sectors Are Positive
Energy and Defensives Shape Leadership
Energy stands apart from a sector field with eight negatives, and three of the eleven S&P 500 sector ETFs are positive on 3M momentum as of October 9. Energy XLE leads at 18.9%. The cross-section's -1.4% median leaves most sectors below zero. The spread is 27.0pp after a 4.0pp compression from last week, with Utilities XLU last at -8.1%. Four sectors gained at least 3.2pp on the week, and eight are negative.
XLE's -0.57 correlation to SPY gives the leader a moderate inverse market link. Technology XLK ranks second and lost 3.7pp over the week. Healthcare XLV rose 4.7pp to 6.6%. Its 0.18 correlation to SPY is weak.
Communication Services 3M Momentum Turned Negative
Communication Services XLC turned negative at -0.8% after a 1.8pp weekly decline. Consumer Staples XLP climbed 4.4pp to -0.2%. Its 0.28 beta leaves that defensive rebound low-amplitude.
Materials XLB, Consumer Discretionary XLY, and Financials XLF joined the rebound, giving cyclicals three of the five largest weekly gains. Utilities XLU sits last at -8.1% after a 4.2pp rebound. Its -0.04 correlation to SPY is near zero, and the usual defensive hedge is absent. Industrials XLI and Real Estate XLRE occupy the bottom tier.
S&P 500 Sectors ETFs Heatmaps
S&P 500 Sectors ETFs 3M Momentum
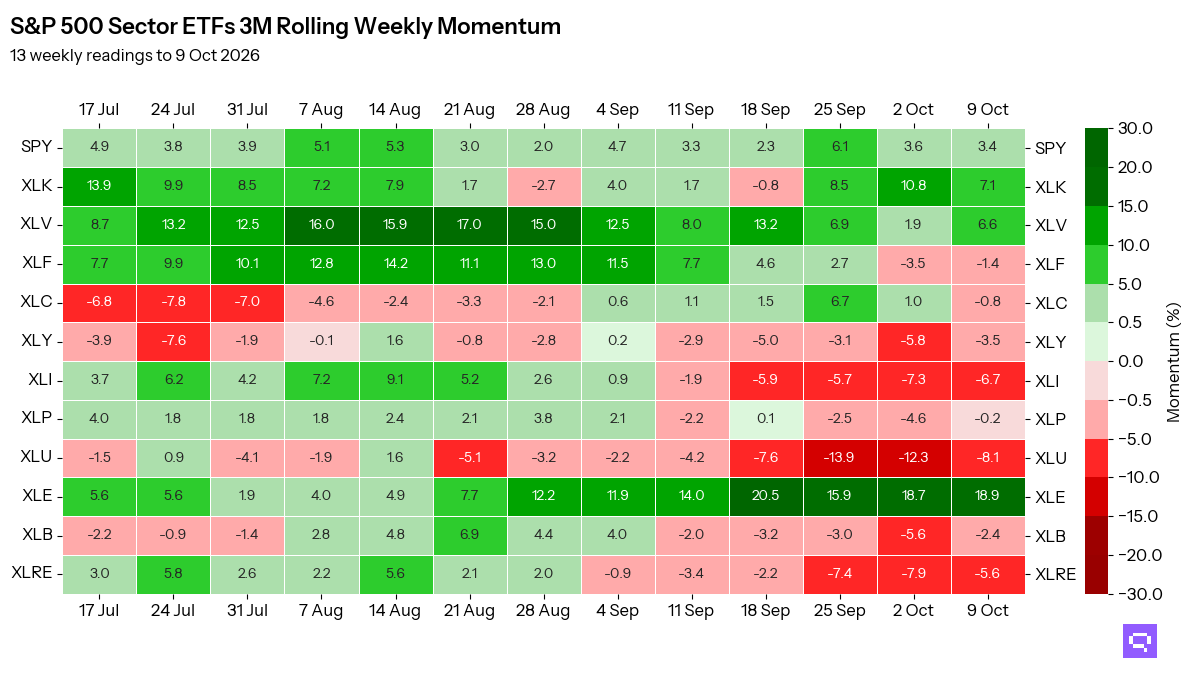
How to read: each cell is the ETF's price change over the previous 13 weeks, as of that week. Read across a row to see its momentum build or fade over the last 13 weeks; read down the last column to compare ETFs this week.
S&P 500 Sectors ETFs 3M Correlation vs SPY
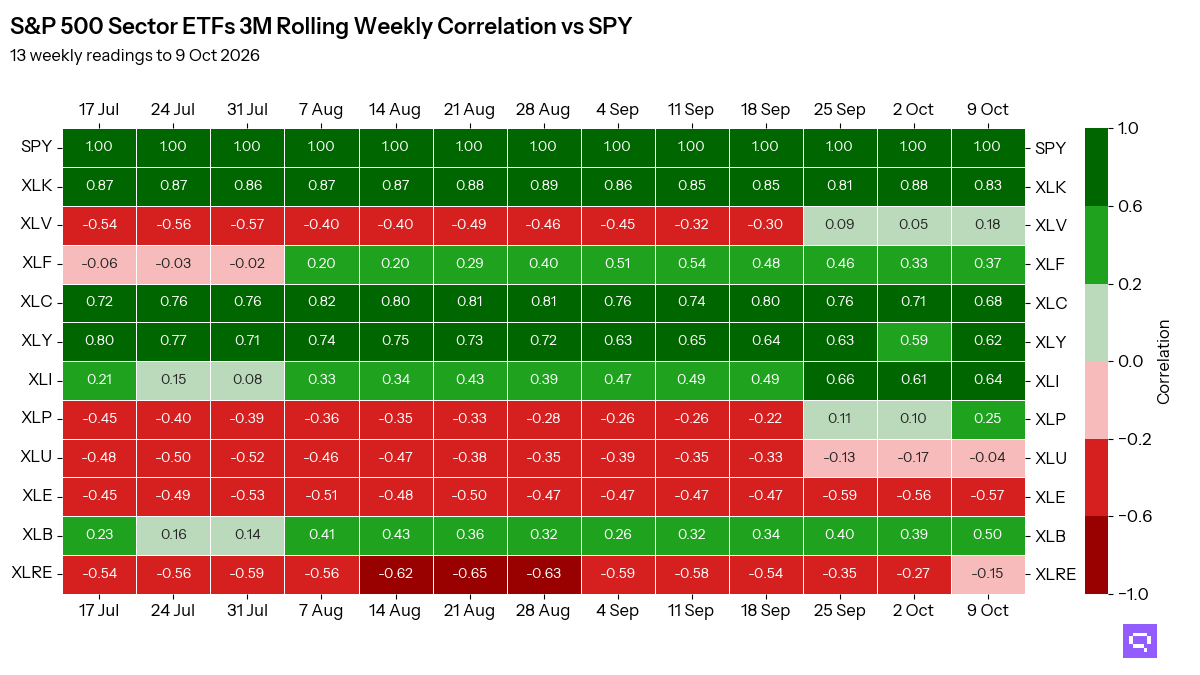
How to read: each cell is how closely the ETF's weekly returns moved in the same direction as SPY over the 13 weeks to that date: 1 moves with SPY, 0 moves independently, below 0 moves opposite. It says nothing about how far it moved.
S&P 500 Sectors ETFs 3M Beta vs SPY
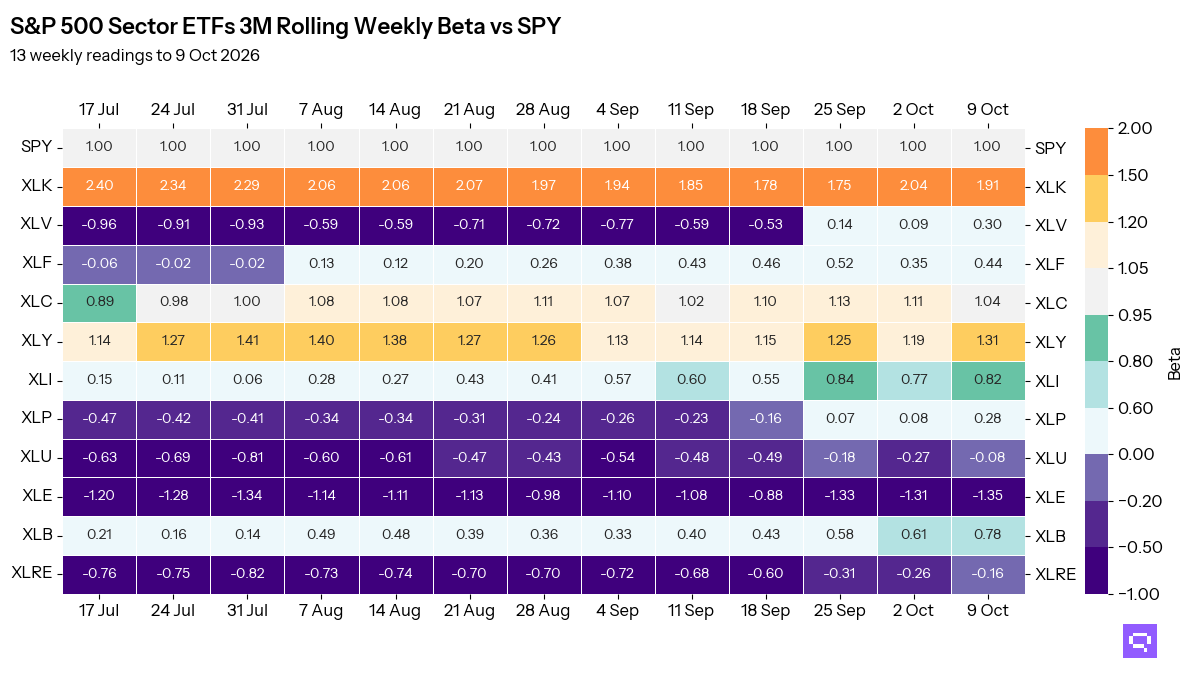
How to read: each cell is how far the ETF moved for each 1% move in SPY, over the same 13 weeks: 1.0 moves in line, 1.5 moves half as much again, 0.5 half as much. Read it with correlation: a high beta only describes the ETF's typical move when its correlation is high too.
Romain Gandon
CEO, Quantlake
Disclaimer: This article is for informational and educational purposes only and does not constitute investment advice. Past performance is not indicative of future results.