.png)

Tactical Trends: Small Caps Rejoin the Equity Lead on Relative Strength
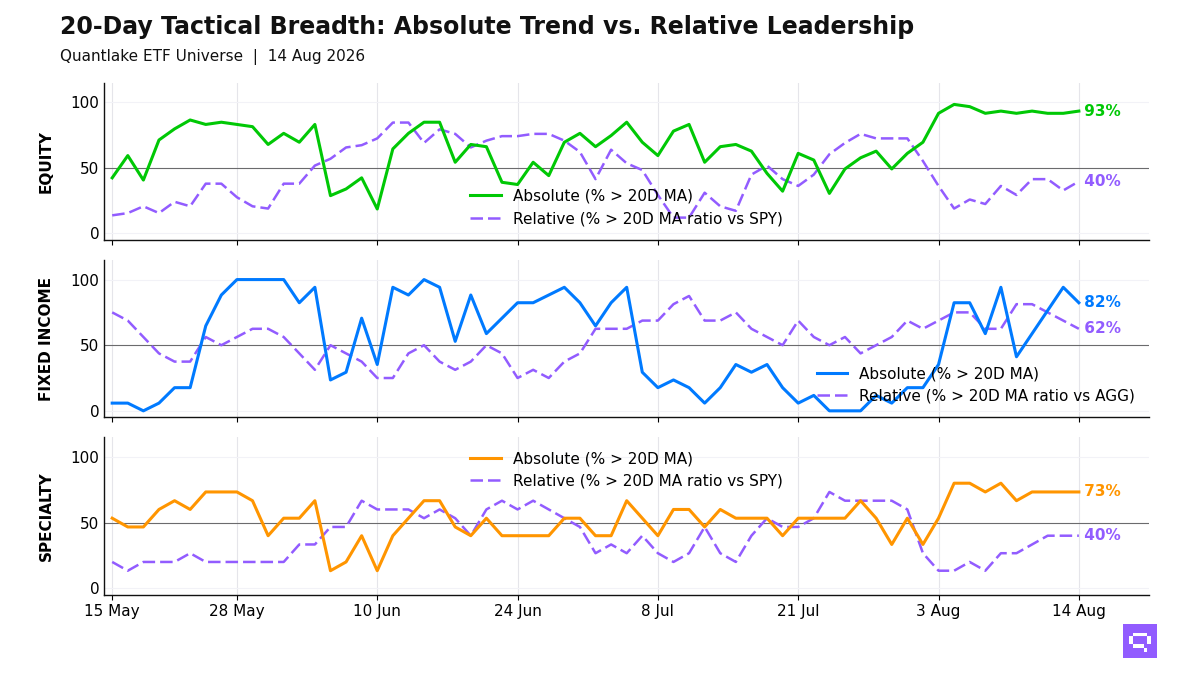
Broad price participation outruns relative confirmation
Equity rotation toward smaller caps strengthened at the close on August 14, with Russell 2000 IWM and Small-Cap VB crossing above the 20-day ratio moving average vs S&P 500 SPY (20D ratio MA vs SPY). Across our ETF universe, 55 of 59 equity ETFs (93%, +1.7pp on the day) hold above their 20-day moving average (20D MA), while 23 of 58 (40%, +6.9pp) hold above their 20D ratio MA vs SPY; the 54pp price-relative gap is wide and narrower than the prior session. The advance is broad in price and selective in leadership.
Fixed income leadership concentrates in credit and short duration, with 10 of 16 beating the Aggregate Bonds AGG. EM debt and high yield lead the relative winners, while intermediate Treasuries and investment grade lag. The bond cross-section rewards stability and spread product.
Specialty leadership concentrates in gold, gold miners, and semiconductors vs the S&P 500 SPY, while bitcoin-linked funds and REITs lag. Oil USO crossed above its 20D MA, and alternative exposure leadership clusters in hard assets.
20-Day Tactical Breadth
Key Takeaways
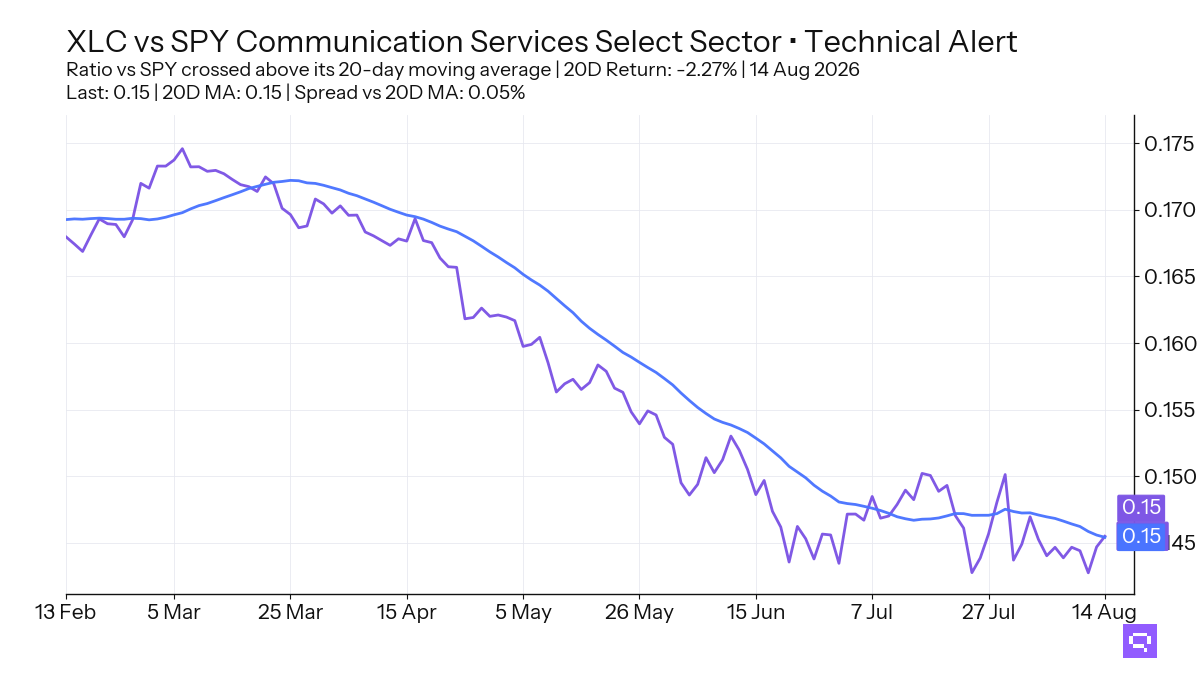
Communication Services XLC, down 2.27% relative to SPY over the trailing 20-day window, crossed above its 20-day ratio moving average. MSCI World URTH also crossed above its 20D ratio MA vs SPY. The pair separates stabilization from follow-through: XLC rises from a negative 20-day relative base, and URTH holds a positive one.
Cross-timescale alignment in equity is 92%. Asia-Pacific and Taiwan equity, along with US growth and small caps, populate the multi-horizon relative leader cluster, while China, Brazil, and defensive-value US exposures populate the laggard side. The equity leadership map concentrates in cyclical beta.
7-10yr Treasuries IEF and Corporate Credit VCIT crossed below their 20D ratio MA vs Aggregate Bonds AGG, while Short TIPS VTIP crossed above. Gold, gold miners, and semiconductors lead specialty vs S&P 500 SPY, and Oil USO crossed above its 20D MA. Cross-asset strength clusters in inflation-sensitive and spread sectors.
FEATURED ETF: Communication Services Select Sector XLC vs SPY
Other Technical Signal Events
Equity: Price vs 20-day MA
| Signal | Ticker | Name | 20D perf |
|---|---|---|---|
| Cross-up | XLRE | The Real Estate Select Sector | -0.33% |
Equity vs SPY: Price Ratio vs 20-day MA
| Signal | Ticker | Name | 20D rel perf |
|---|---|---|---|
| Cross-up | XLC | Communication Services Select Sector | -2.27% |
| Cross-up | IWM | iShares Russell 2000 ETF | -0.66% |
| Cross-up | VB | Vanguard Small-Cap Index ETF | unch. |
| Cross-up | URTH | iShares MSCI World ETF | +0.16% |
Fixed Income: Price vs 20-day MA
| Signal | Ticker | Name | 20D perf |
|---|---|---|---|
| Cross-down | BNDX | Vanguard Total International Bond Index ETF | -0.19% |
| Cross-down | LQD | iShares iBoxx $ Investment Grade Corporate Bond ETF | -0.91% |
Fixed Income vs AGG: Price Ratio vs 20-day MA
| Signal | Ticker | Name | 20D rel perf |
|---|---|---|---|
| Cross-up | VTIP | Vanguard Short-Term Inflation-Protected Securities Index ETF | +0.40% |
| Cross-down | VCIT | Vanguard Intermediate-Term Corporate Bond Index ETF | unch. |
| Cross-down | IEF | iShares 7-10 Year Treasury Bond ETF | -0.13% |
Commodities: Price vs 20-day MA
| Signal | Ticker | Name | 20D perf |
|---|---|---|---|
| Cross-up | USO | United States Oil Fund LP | +2.13% |
Romain Gandon
CEO, Quantlake
Disclaimer: This article is for informational and educational purposes only and does not constitute investment advice. Past performance is not indicative of future results.