.png)

Tactical Trends: International and Tech Reclaim 20-Day Averages
Equity price participation lifts, but relative winners stay defensive vs SPY.
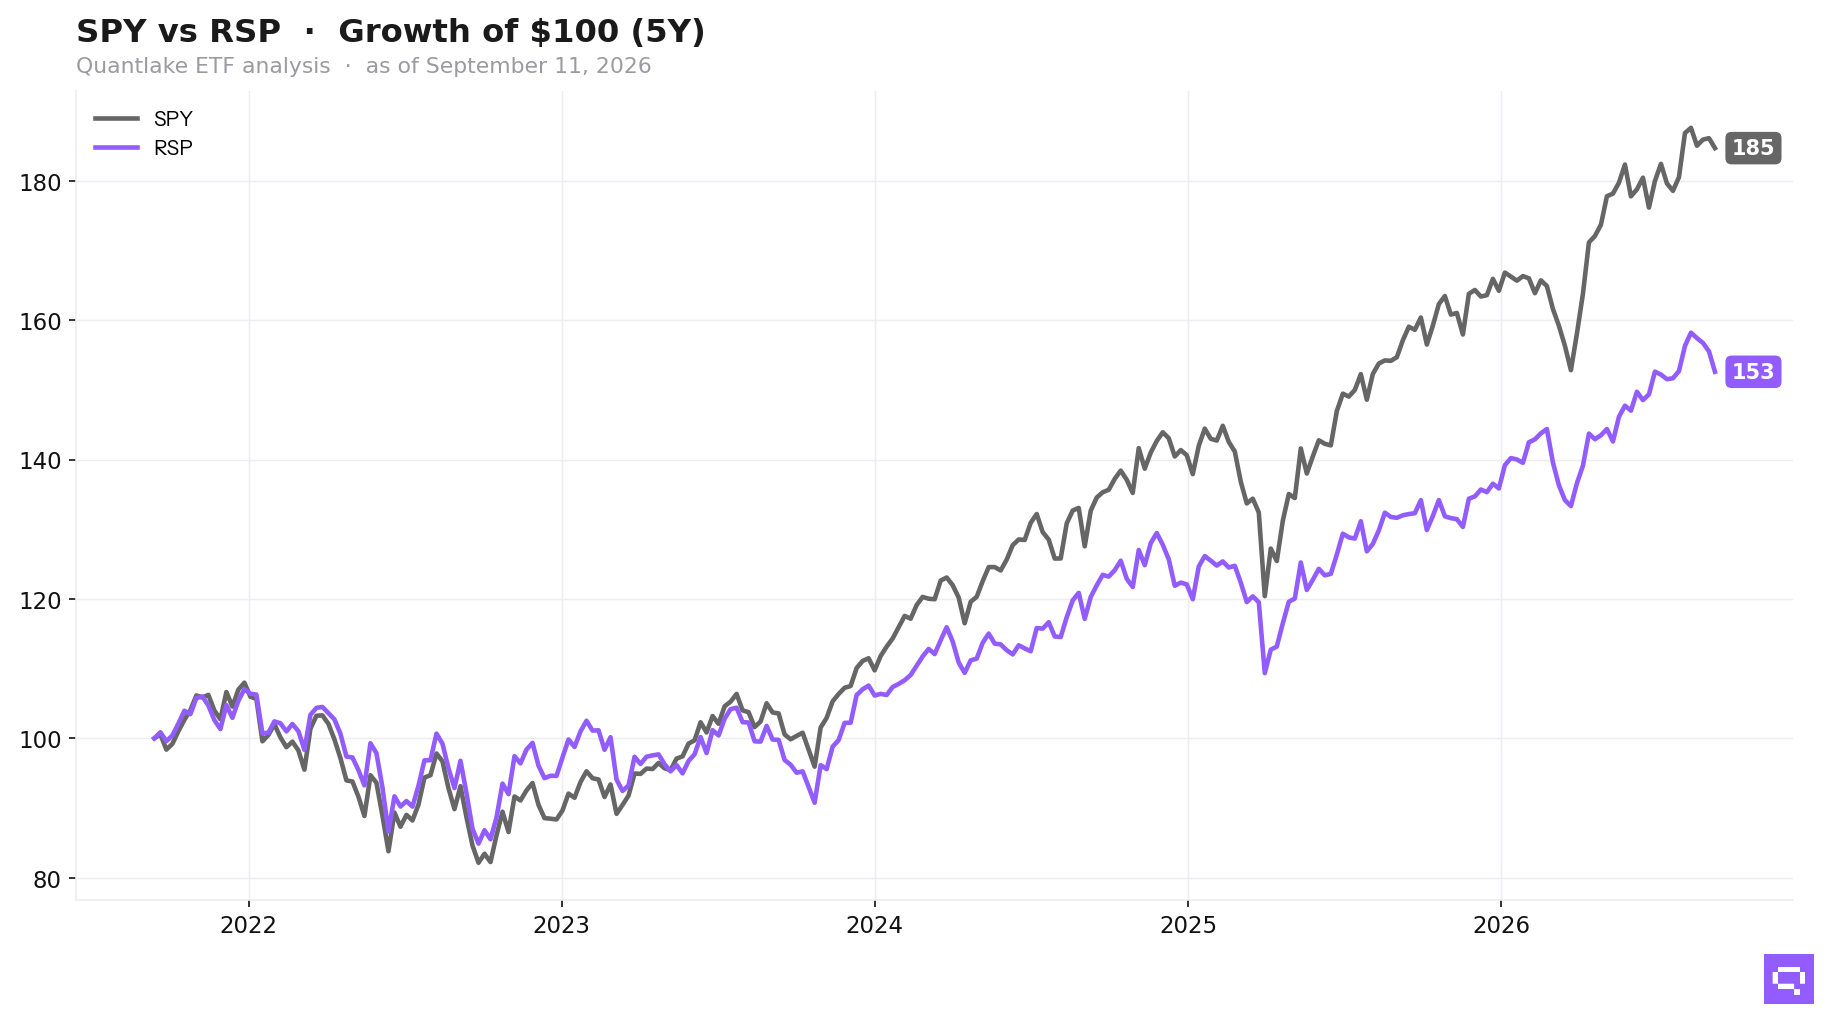
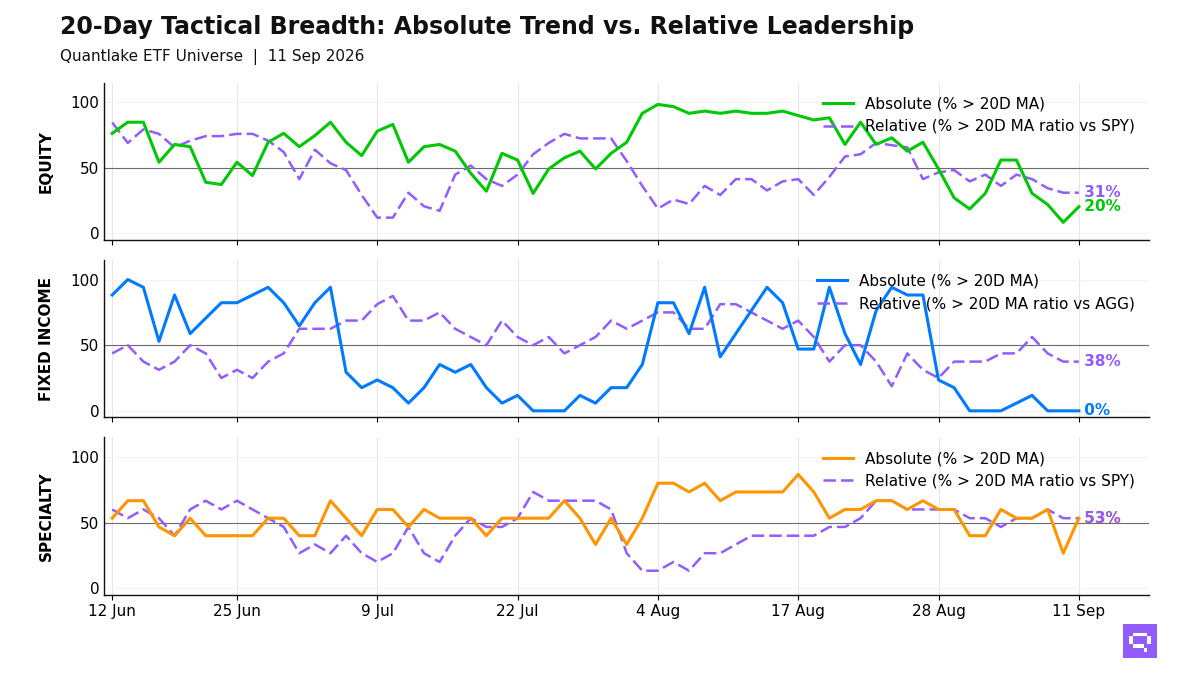
Recoveries in international and tech exposures shaped equity at the close on September 11, with 12 of 59 ETFs (20%, +11.9pp on the day) above their 20-day moving averages (20D MA) and 18 of 58 (31%, unchanged) above their ratio MAs vs the S&P 500 SPY, a -11pp price-relative gap. Emerging markets EEM and Technology XLK crossed above their 20D MA, and price leadership clustered in Asia-Pacific, value, communication services, energy, and technology. The equity configuration leaves relative rotation ahead of price confirmation, with low-volatility, momentum, and growth ratios above their averages even where price is below its average.
Fixed income has no price participation, with 0 of 17 ETFs above their 20D MA, and relative winners vs the Aggregate Bonds AGG are limited to short duration, preferreds, high yield, and Global Bonds BNDX. 3-7yr Treasuries IEI and TIPS TIP crossed below their ratio MAs, so bond leadership concentrates in credit and short duration, and rate-sensitive duration lags.
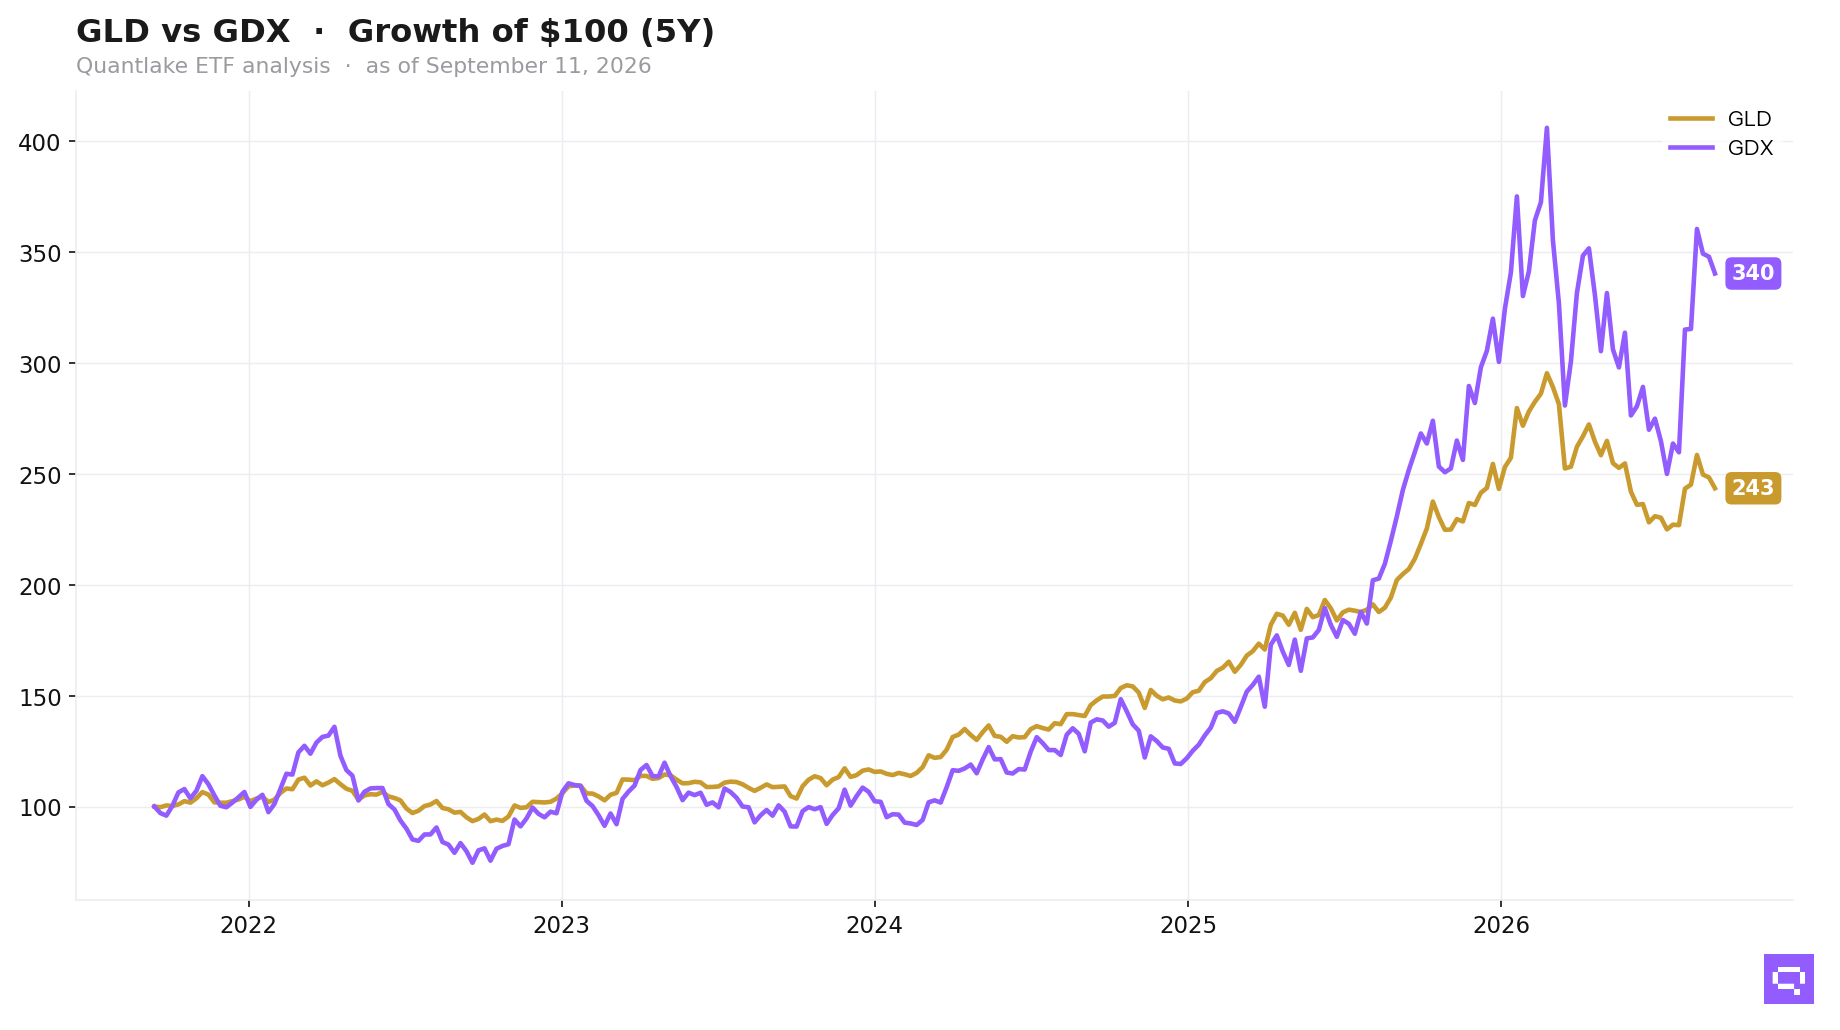
Specialty participation centers on crypto-linked exposures, Long/Short Equity FTLS, and Semiconductors SMH, with 8 of 15 ETFs above both price and ratio MAs vs the S&P 500 SPY; real estate, gold, and minimum-volatility names fill the laggard cluster. Oil and broad commodities lead the commodity group, and copper is the commodity laggard. Specialty and commodity leadership skews toward cyclical and crypto exposure.
20-Day Tactical Breadth
Key Takeaways
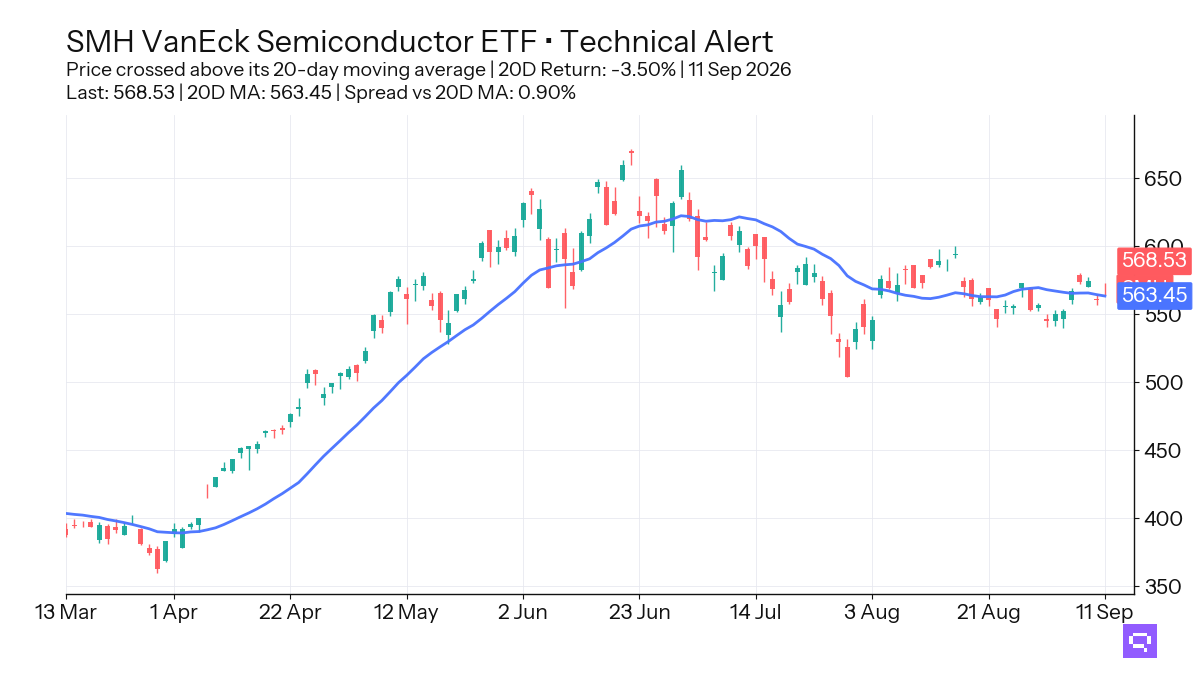
Semiconductors SMH fell 3.50% over the trailing 20-day window and crossed above its 20D MA. Specialty leadership concentrates in crypto-linked, tactical equity, and momentum exposure.
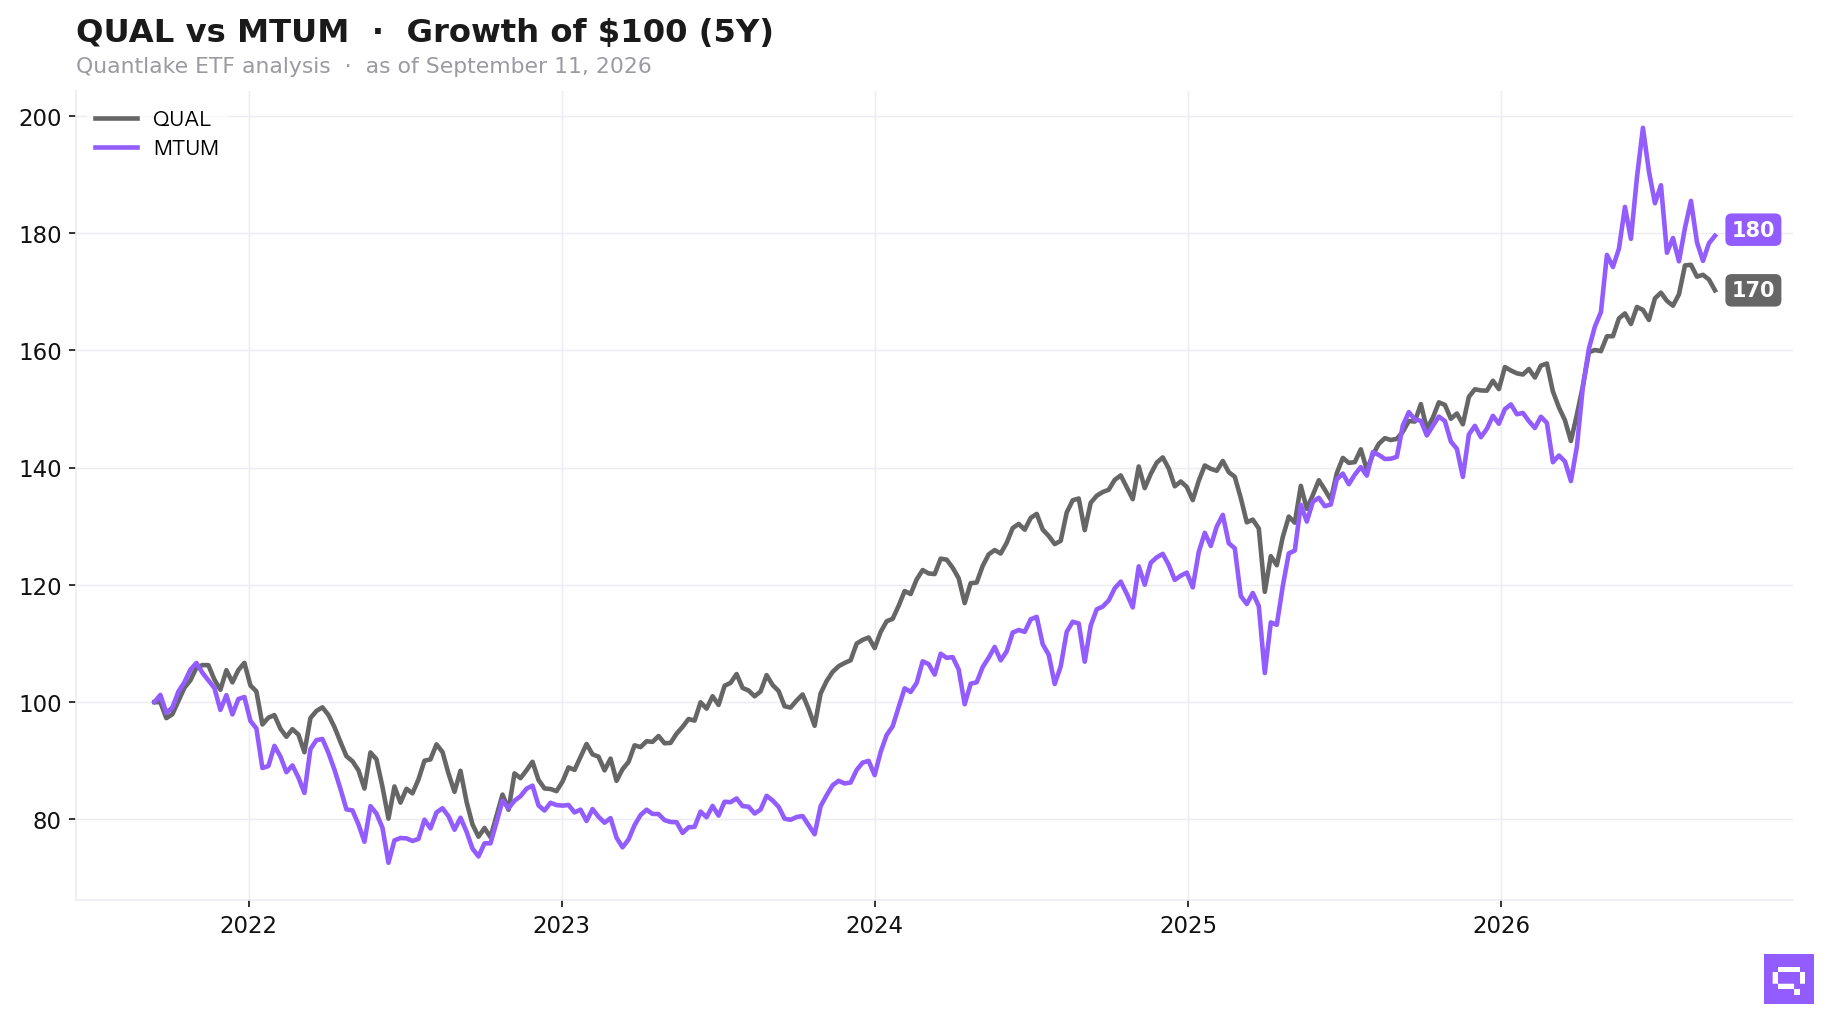
Low-volatility EFAV, Momentum Factor IMTM, and growth ratios sit below their price averages but above their ratio MAs vs the S&P 500 SPY. Relative leadership concentrates in three theme groups even where price confirmation is absent.
Global Bonds BNDX and Preferred Stock PFF crossed above their ratio MAs vs the Aggregate Bonds AGG, while 3-7yr Treasuries IEI and TIPS TIP crossed below. The bond cross-section favors credit and short duration over duration-sensitive government exposure.
FEATURED ETF: VanEck Semiconductor ETF SMH
Other Technical Signal Events
Equity: Price vs 20-day MA
| Signal | Ticker | Name | 20D perf |
|---|---|---|---|
| Cross-up | XLK | Technology Select Sector | -1.62% |
| Cross-up | IYW | iShares U.S. Technology ETF | -1.30% |
| Cross-up | XLC | Communication Services Select Sector | unch. |
| Cross-up | VLUE | iShares MSCI USA Value Factor ETF | +0.15% |
| Cross-up | IVLU | iShares Edge MSCI Intl Value Factor ETF | +0.74% |
| Cross-up | IDV | iShares International Select Dividend ETF | +1.31% |
| Cross-up | EEM | iShares MSCI Emerging Markets ETF | +1.74% |
Fixed Income vs AGG: Price Ratio vs 20-day MA
| Signal | Ticker | Name | 20D rel perf |
|---|---|---|---|
| Cross-up | PFF | iShares Preferred and Income Securities ETF | -0.52% |
| Cross-up | BNDX | Vanguard Total International Bond Index ETF | -0.26% |
| Cross-down | TIP | iShares TIPS Bond ETF | +0.18% |
| Cross-down | IEI | iShares 3-7 Year Treasury Bond ETF | -0.18% |
Specialty: Price vs 20-day MA
| Signal | Ticker | Name | 20D perf |
|---|---|---|---|
| Cross-up | SMH | VanEck Semiconductor ETF | -3.50% |
| Cross-up | MTUM | iShares MSCI USA Momentum Factor ETF | -2.84% |
| Cross-up | JEPQ | JPMorgan Nasdaq Equity Premium Income ETF | unch. |
| Cross-up | FTLS | First Trust Long/Short Equity ETF | +0.34% |
Romain Gandon
CEO, Quantlake
Disclaimer: This article is for informational and educational purposes only and does not constitute investment advice. Past performance is not indicative of future results.