Tactical Market Trends: Low-Vol Leads as Brazil Breaks Lower at Close
Equity breadth rises to 51%; 60% beat SPY
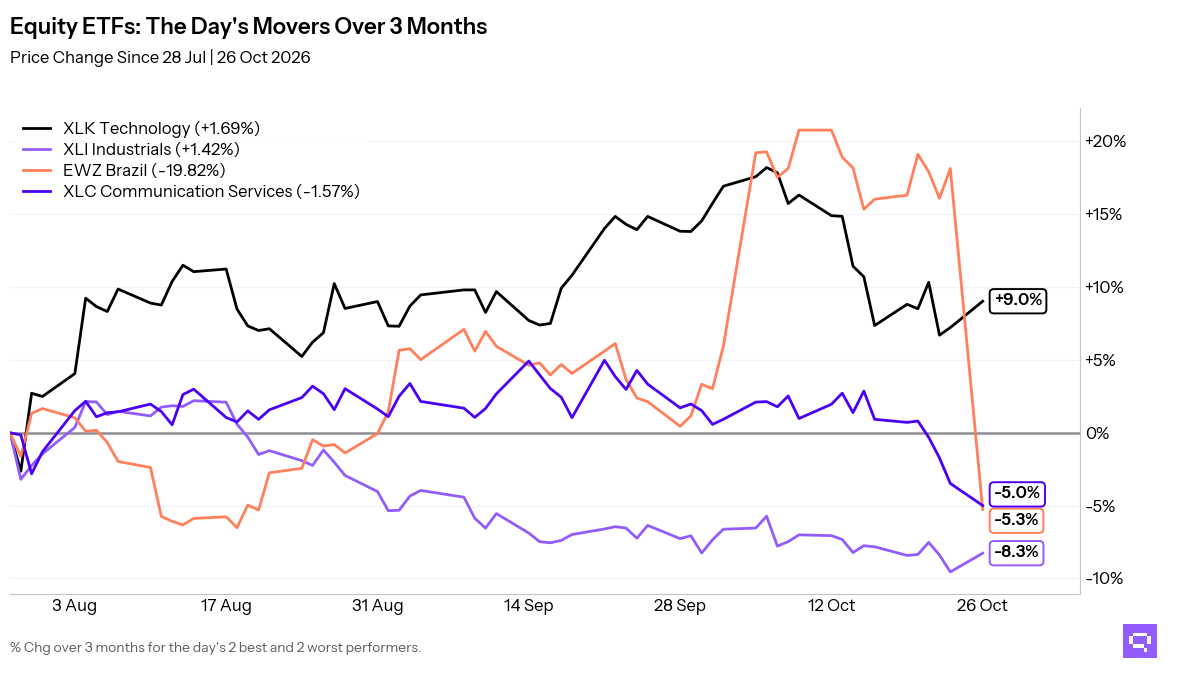
Dividend and low-volatility equity led at the close on October 26, with 30 of 59 ETFs (51%, +5.1pp on the day) above their 20-day moving average (20D MA), and 35 of 58 ETFs (60%, -5.2pp) outperforming the S&P 500 SPY. Low-volatility and dividend-heavy US equity accounted for 7 of the 30 price leaders. Brazil, China, and the rest of Asia-Pacific accounted for 7 of the 29 price laggards. Germany EWG added one developed-Europe price recovery. Brazil EWZ crossed below both its price MA and its ratio MA vs the benchmark.
Fixed income leadership stayed limited to long duration, inflation-linked debt, and investment grade credit, with 6 of 16 funds outperforming the Aggregate Bonds AGG. Long duration contributed 1 relative leader. Short duration contributed 2 relative laggards. Investment Grade Credit LQD crossed above its ratio MA vs AGG.
Specialty leadership stayed limited to real estate, low-volatility, and biotech, with 5 of 15 names outperforming the S&P 500 SPY. Managed Futures DBMF crossed below its ratio MA vs SPY. Oil and broad commodities led the commodity field. Silver lagged.

Key Takeaways
Brazil EWZ fell 5.69% over the trailing 20-day window and crossed below its 20D MA. EWZ also crossed below its ratio MA vs the S&P 500 SPY, and Brazil sits in the daily, weekly, and monthly relative laggard cluster.
Small-cap VB and Germany EWG added fresh price recoveries with crosses above their 20D MA. S&P SmallCap Growth SLYG joined the same price-cross group.
Biotech IBB and low-volatility USMV align across daily, weekly, and monthly absolute and relative leadership. Gold and miners stay in the specialty laggard cluster, and oil and broad commodities lead commodities.
Featured ETF: iShares MSCI Brazil ETF EWZ

Technical Signals
Equity: Price vs 20-day MA
| Signal | Ticker | Name | 20D perf |
|---|---|---|---|
| Cross-up | EWG | iShares MSCI Germany ETF | -2.11% |
| Cross-up | VGK | Vanguard FTSE Europe Index ETF | -2.07% |
| Cross-up | SLYG | SPDR S&P 600 Small Cap Growth ETF | +0.25% |
| Cross-up | VB | Vanguard Small-Cap Index ETF | +0.71% |
| Cross-down | EWZ | iShares MSCI Brazil ETF | -5.69% |
Equity vs SPY: Price Ratio vs 20-day MA
| Signal | Ticker | Name | 20D rel perf |
|---|---|---|---|
| Cross-down | QUAL | iShares MSCI USA Quality Factor ETF | +0.34% |
| Cross-down | URTH | iShares MSCI World ETF | -0.43% |
| Cross-down | EWZ | iShares MSCI Brazil ETF | -5.66% |
Fixed Income vs AGG: Price Ratio vs 20-day MA
| Signal | Ticker | Name | 20D rel perf |
|---|---|---|---|
| Cross-up | LQD | iShares iBoxx $ Investment Grade Corporate Bond ETF | +0.11% |
Specialty vs SPY: Price Ratio vs 20-day MA
| Signal | Ticker | Name | 20D rel perf |
|---|---|---|---|
| Cross-down | DBMF | iMGP DBi Managed Futures Strategy ETF | +0.25% |
Related
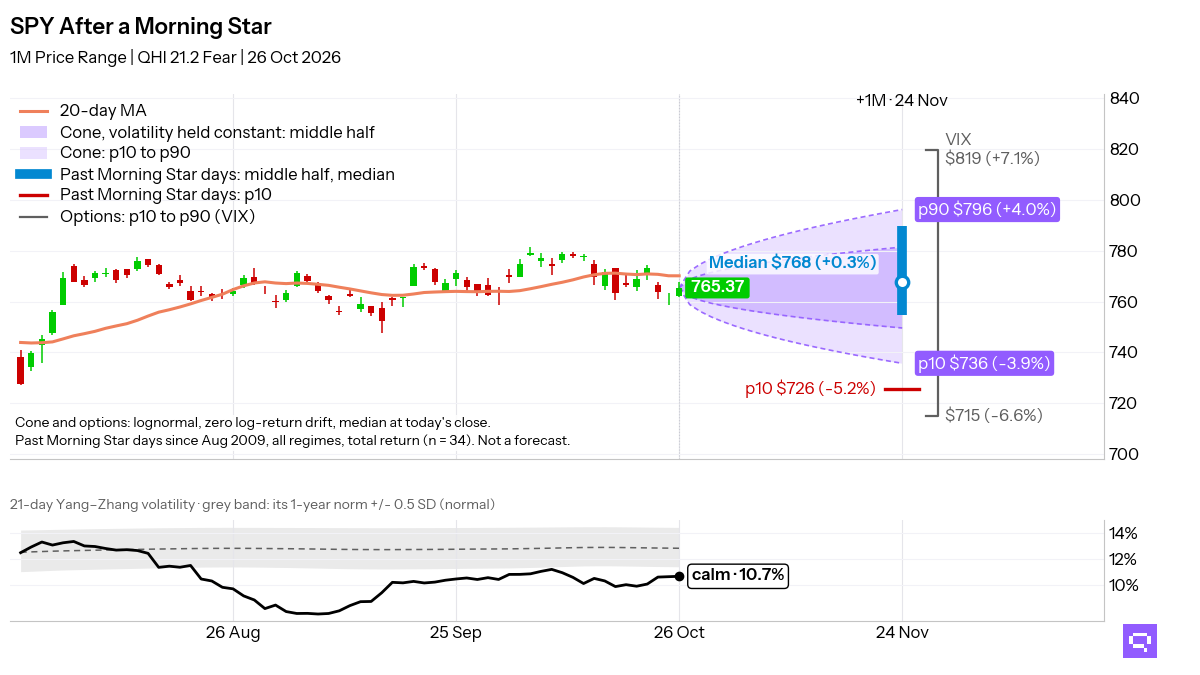
- SPY candlestick signals: forward returns by pattern and sentiment
- Fear and greed: today's market sentiment reading
- ETF trend metrics explained
Romain Gandon
CEO, Quantlake
Disclaimer: This article is for informational and educational purposes only and does not constitute investment advice. Past performance is not indicative of future results.