.png)
Tactical Trends: Growth Slips as Equity Breadth Breaks Lower
Price participation fell faster than relative leadership
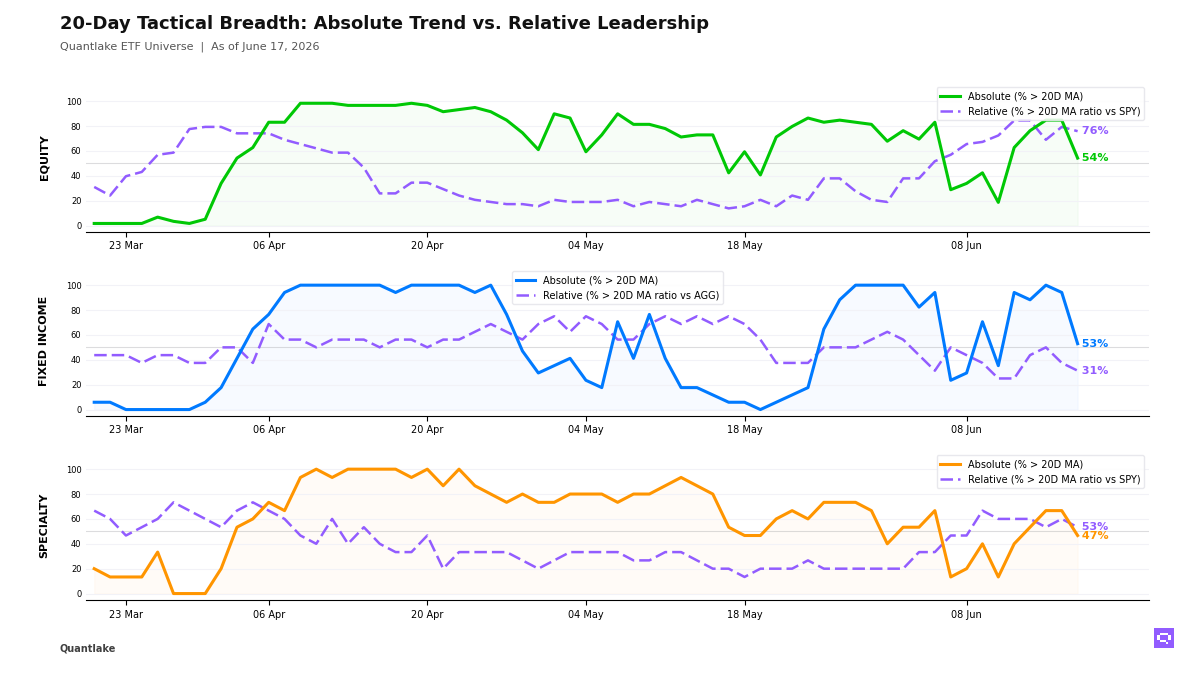
As of June 17, growth and rate-sensitive equity groups broke below their 20-day moving average (20D MA) across our ETF universe. Equity price breadth sits at 32 of 59 ETFs (54%, -30.5pp), down from 85% on the prior close, while 44 of 58 ETFs (76%, -3.5pp) outperform the S&P 500 SPY; US growth, real estate, and China populate the laggard side, while small caps, Asia-Pacific, and value hold the relative leadership. The 22pp gap between relative and absolute breadth leaves an equity tape in which benchmark-relative resilience outlasts price participation.
Fixed income narrowed even faster. Price breadth sits at 9 of 17 ETFs (53%, -41.2pp), while only 5 of 16 ETFs (31%, -6.2pp) outperform the Aggregate Bonds AGG; long duration, munis, and higher-quality credit lead, while intermediate Treasuries and high yield lag. The bond tape reflects a selective rebound in duration and quality rather than broad participation.
Specialty breadth also weakened, with 7 of 15 ETFs (47%, -20.0pp) above their 20D MA and 8 of 15 (53%, -6.7pp) outperforming the S&P 500 SPY; semiconductors, biotech, and infrastructure lead, while real estate, crypto, and clean energy lag. Copper CPER crossed below its 20D MA and below its 20D ratio MA vs the S&P 500 SPY, while Agriculture Basket DBA crossed above its 20D ratio MA vs SPY after a -6.02% 20-day return. The non-core mix splits between residual equity-like leadership and deterioration in industrial metals, real estate, and crypto.
20-Day Tactical Breadth
Key Takeaways
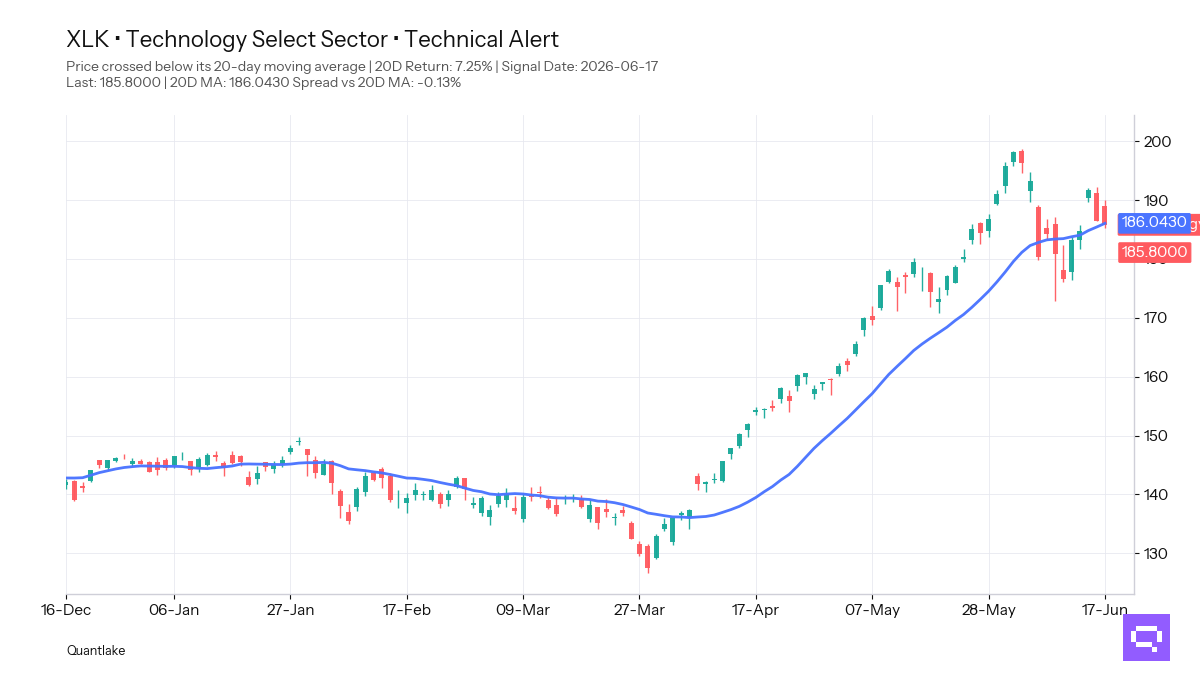
Technology XLK, with a +7.25% period return, crossed below its 20-day moving average. US Technology IYW and Nasdaq 100 QQQ followed after +5.07% and +2.99% 20-day returns. All three sit in the divergent bucket against the S&P 500 SPY. The growth pullback is a price reset inside residual relative strength.
Muni Bonds MUB crossed above its 20D ratio MA vs the Aggregate Bonds AGG. 7-10yr Treasuries IEF and Mortgage-Backed MBB crossed below their ratio MA vs AGG. Long-duration TLT, International Aggregate BNDX, EM Debt EMB, and Investment Grade LQD align on both price and relative strength, while High Yield HYG crossed below its 20D MA. Fixed-income leadership concentrates in long duration, munis, and higher-quality spread exposure.
Semiconductors SMH, Biotech IBB, Infrastructure PAVE, and Momentum MTUM align across daily, weekly, and monthly price states. Gold GLD, Bitcoin IBIT, and Ether ETHA sit in three-timescale laggard buckets. Real Estate VNQ lost both price and relative footing. Global REITs REET fell below its 20D MA while outperforming the S&P 500 SPY on a relative basis. Specialty leadership concentrates in semiconductor, biotech, and infrastructure exposure rather than real assets or crypto.
FEATURED ETF: Technology Select Sector XLK
Other Technical Signal Events
EQUITY
↗ Price breakouts (cross-up 20D MA)
None on the close
↘ Price breakdowns (cross-down 20D MA)
XLK - Technology Select Sector · 20D perf: +7.25%
IYW - iShares U.S. Technology ETF · +5.07%
QQQ - Invesco QQQ · +2.99%
QUAL - iShares MSCI USA Quality Factor ETF · +2.52%
VT - Vanguard Total World Stock Index ETF · +2.48%
XLV - Health Care Select Sector · +2.30%
URTH - iShares MSCI World ETF · +1.69%
VTI - Vanguard Total Stock Market Index ETF · +1.63%
DVY - iShares Select Dividend ETF · +1.45%
SPYV - S&P 500 Value ETF · +1.05%
SPYG - S&P 500 Growth ETF · +1.03%
EWU - iShares MSCI United Kingdom ETF · +0.62%
XLY - Consumer Discretionary Select Sector · +0.40%
XLRE - The Real Estate Select Sector · unch.
SCHD - Schwab U.S. Dividend Equity ETF · -0.53%
ACWV - iShares MSCI Global Min Vol Factor ETF · -1.27%
XLP - Consumer Staples Select Sector · -2.80%
↗ Leadership gains (cross-up 20D MA vs SPY)
None on the close
↘ Leadership losses (cross-down 20D MA vs SPY)
XLY - Consumer Discretionary Select Sector · 20D relative perf: -0.58%
XLRE - The Real Estate Select Sector · -0.91%
FIXED INCOME
↗ Price breakouts (cross-up 20D MA)
None on the close
↘ Price breakdowns (cross-down 20D MA)
VCIT - Vanguard Intermediate-Term Corporate Bond Index ETF · 20D perf: +1.25%
HYG - iShares iBoxx $ High Yield Corporate Bond ETF · +0.99%
PFF - iShares Preferred and Income Securities ETF · +0.83%
VGIT - Vanguard Intermediate-Term Treasury Index ETF · +0.71%
IEI - iShares 3-7 Year Treasury Bond ETF · +0.51%
VCSH - Vanguard Short-Term Corporate Bond Index ETF · +0.44%
TIP - iShares TIPS Bond ETF · +0.17%
↗ Leadership gains (cross-up 20D MA vs AGG)
MUB - iShares National Muni Bond ETF · 20D relative perf: +0.16%
↘ Leadership losses (cross-down 20D MA vs AGG)
MBB - iShares MBS ETF · 20D relative perf: +0.20%
IEF - iShares 7-10 Year Treasury Bond ETF · unch.
SPECIALTY
↗ Price breakouts (cross-up 20D MA)
None on the close
↘ Price breakdowns (cross-down 20D MA)
REET - iShares Global REIT ETF · 20D perf: +0.71%
VNQ - Vanguard Real Estate Index ETF · +0.35%
USMV - iShares MSCI USA Min Vol Factor ETF · -0.89%
↗ Leadership gains (cross-up 20D MA vs SPY)
None on the close
↘ Leadership losses (cross-down 20D MA vs SPY)
VNQ - Vanguard Real Estate Index ETF · 20D relative perf: -0.63%
COMMODITIES
↗ Price breakouts (cross-up 20D MA)
None on the close
↘ Price breakdowns (cross-down 20D MA)
CPER - United States Copper LP · 20D perf: +2.68%
↗ Leadership gains (cross-up 20D MA vs SPY)
DBA - Invesco DB Agriculture · 20D relative perf: -6.02%
↘ Leadership losses (cross-down 20D MA vs SPY)
CPER - United States Copper LP · 20D relative perf: +1.68%
Romain Gandon
CEO, Quantlake
Disclaimer: This article is for informational and educational purposes only and does not constitute investment advice. Past performance is not indicative of future results.