.png)

Regime Trends: Developed Ex-US and Dividend Leadership Gain Ground
Price participation is broad; relative confirmation trails by 35pp
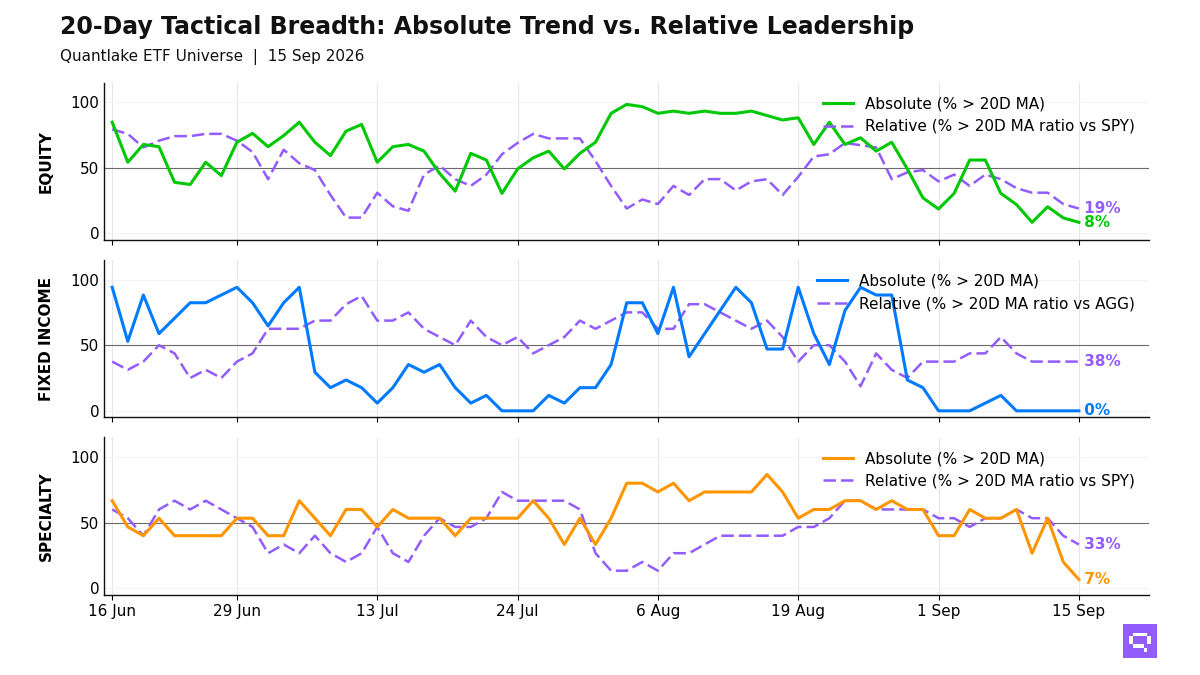
International and income leadership strengthened into the July 31 close, led by Dev. Markets EFA and Select Dividend DVY on relative-strength confirmations vs S&P 500 SPY. Across our ETF universe, 53 of 59 equity ETFs (90%, unchanged on the month) hold above their 10-month moving average (10M MA), while 32 of 58 (55%, +10.3pp) hold above their 10-month ratio moving average vs S&P 500 SPY, leaving a 35pp price-relative gap. Low-volatility, emerging-markets, and several growth-heavy exposures sit in the price-above, benchmark-lagging cluster, so price participation is broad and leadership is only partly confirmed.
Only 5 of 17 fixed-income ETFs (29%) hold above their 10M MA, and price leadership is limited to high-yield credit, EM debt, and short duration. Against Aggregate Bonds AGG, intermediate Treasuries, TIPS, preferreds, and parts of credit lead on a relative basis, while long-duration Treasuries and Investment Grade Credit LQD lag. The bond cross-section separates stability and intermediate duration from long rate sensitivity.
Specialty leadership is limited to semiconductors, real estate, and biotech, with 6 of 15 ETFs beating the S&P 500 SPY; gold, bitcoin proxies, and Clean Energy ICLN fill the laggard cluster. Broad Commodities PDBC crossed above its 10-month ratio moving average vs S&P 500 SPY, and cross-timescale strength concentrates in oil and copper. Hard-asset leadership is selective.
10-Month Regime Breadth

Key Takeaways
Brazil EWZ, up 23.53% over the trailing 10-month window, crossed above its 10-month moving average. EWZ holds above its 10M MA while lagging the S&P 500 SPY on a relative basis, alongside parts of the broader international equity bucket. International price recovery exceeds relative leadership.
3-7yr Treasuries IEI, TIPS TIP, and Preferred Stock PFF crossed above their 10-month ratio moving average versus Aggregate Bonds AGG. Global Bonds BNDX, Mortgage-Backed MBB, and Corporate Credit VCIT crossed below their 10M MA. Fixed-income leadership concentrates in intermediate duration and relative defense.
Global REITs REET and Real Estate VNQ crossed above their 10-month ratio moving average versus S&P 500 SPY, while Covered Calls Nasdaq JEPQ and Clean Energy ICLN crossed below. Broad Commodities PDBC crossed above its 10-month ratio moving average versus S&P 500 SPY and joins oil and copper in the cross-timescale leader cluster. Hard-asset participation is selective across specialty and commodities.
FEATURED ETF: iShares MSCI Brazil ETF EWZ

Other Technical Signal Events
Equity: Price vs 10-month MA
| Signal | Ticker | Name | 10M perf |
|---|---|---|---|
| Cross-up | EWZ | iShares MSCI Brazil ETF | +23.5% |
| Cross-down | XLU | Utilities Select Sector | +3.8% |
Equity vs SPY: Price Ratio vs 10-month MA
| Signal | Ticker | Name | 10M rel perf |
|---|---|---|---|
| Cross-up | XLF | Financial Select Sector | -5.4% |
| Cross-up | XLRE | The Real Estate Select Sector | -2.9% |
| Cross-up | IQLT | iShares MSCI Intl Quality Factor ETF | +2.9% |
| Cross-up | DVY | iShares Select Dividend ETF | +3.1% |
| Cross-up | VGK | Vanguard FTSE Europe Index ETF | +3.2% |
| Cross-up | EFA | iShares MSCI EAFE ETF | +3.4% |
| Cross-up | VYM | Vanguard High Dividend Yield Index ETF | +3.5% |
| Cross-up | EWU | iShares MSCI United Kingdom ETF | +5.5% |
| Cross-up | IDV | iShares International Select Dividend ETF | +12.3% |
| Cross-up | IVLU | iShares Edge MSCI Intl Value Factor ETF | +12.4% |
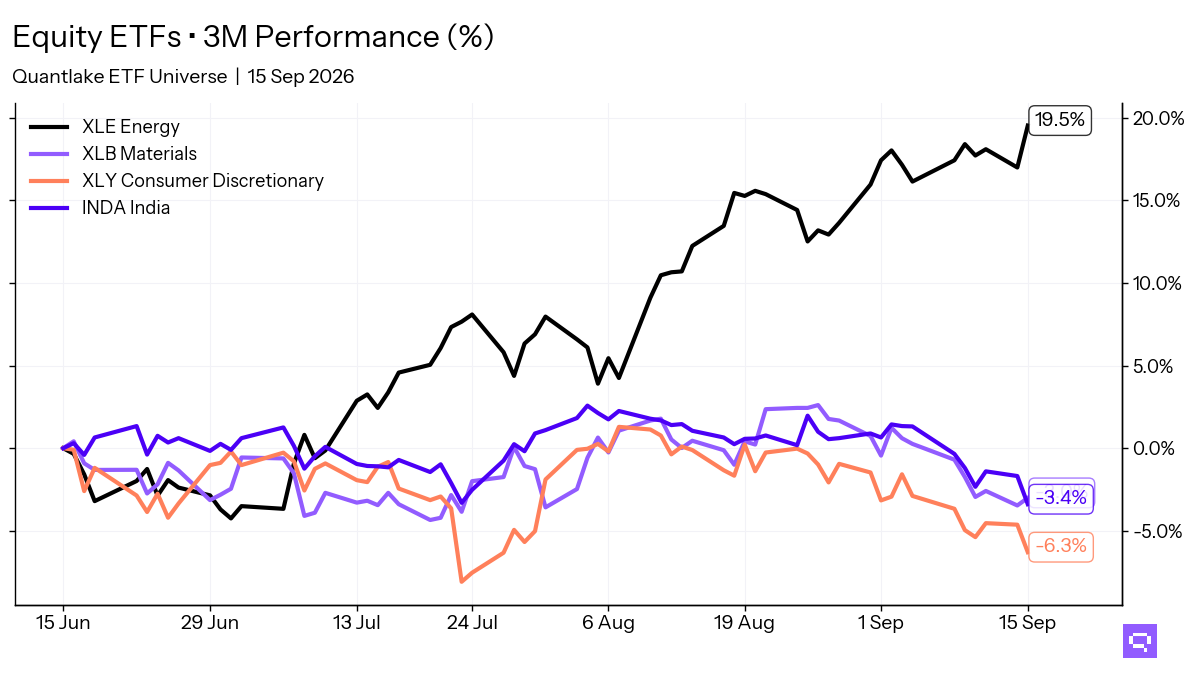
| Cross-up | XLE | Energy Select Sector | +20.5% |
| Cross-down | EEM | iShares MSCI Emerging Markets ETF | +8.2% |
| Cross-down | EWJ | iShares MSCI Japan ETF | +6.3% |
| Cross-down | QQQ | Invesco QQQ | +1.7% |
| Cross-down | VT | Vanguard Total World Stock Index ETF | +1.4% |
| Cross-down | IMTM | iShares MSCI Intl Momentum Factor ETF | +1.0% |
Fixed Income: Price vs 10-month MA
| Signal | Ticker | Name | 10M perf |
|---|---|---|---|
| Cross-down | MUB | iShares National Muni Bond ETF | +1.9% |
| Cross-down | MBB | iShares MBS ETF | +1.2% |
| Cross-down | BNDX | Vanguard Total International Bond Index ETF | +0.5% |
| Cross-down | VCIT | Vanguard Intermediate-Term Corporate Bond Index ETF | +0.5% |
| Cross-down | TIP | iShares TIPS Bond ETF | +0.5% |
| Cross-down | LQD | iShares iBoxx $ Investment Grade Corporate Bond ETF | -1.1% |
Fixed Income vs AGG: Price Ratio vs 10-month MA
| Signal | Ticker | Name | 10M rel perf |
|---|---|---|---|
| Cross-up | VGIT | Vanguard Intermediate-Term Treasury Index ETF | unch. |
| Cross-up | IEI | iShares 3-7 Year Treasury Bond ETF | unch. |
| Cross-up | TIP | iShares TIPS Bond ETF | unch. |
| Cross-up | PFF | iShares Preferred and Income Securities ETF | +0.3% |
| Cross-down | LQD | iShares iBoxx $ Investment Grade Corporate Bond ETF | -1.4% |
Specialty: Price vs 10-month MA
| Signal | Ticker | Name | 10M perf |
|---|---|---|---|
| Cross-down | ICLN | iShares Global Clean Energy ETF | +14.6% |
Specialty vs SPY: Price Ratio vs 10-month MA
| Signal | Ticker | Name | 10M rel perf |
|---|---|---|---|
| Cross-up | VNQ | Vanguard Real Estate Index ETF | -1.5% |
| Cross-up | REET | iShares Global REIT ETF | +0.9% |
| Cross-down | ICLN | iShares Global Clean Energy ETF | +1.3% |
| Cross-down | JEPQ | JPMorgan Nasdaq Equity Premium Income ETF | -1.8% |
Commodities vs SPY: Price Ratio vs 10-month MA
| Signal | Ticker | Name | 10M rel perf |
|---|---|---|---|
| Cross-up | PDBC | Invesco Optimum Yield Diversified Commodity Strategy No K-1 ETF | +20.1% |
Romain Gandon
CEO, Quantlake
Disclaimer: This article is for informational and educational purposes only and does not constitute investment advice. Past performance is not indicative of future results.