.png)
Regime Trends: Cyclicals and Size Anchor a Benchmark-Led Equity Tape
A 45pp price-relative gap limits confirmation
As of June 30, 53 of 59 equity ETFs in our ETF universe (90%, -3.4pp in June) hold above their 10-month moving average (10M MA), while only 26 of 58 (45%, +8.6pp) hold above their 10-month ratio moving average vs the S&P 500 SPY (10M ratio MA vs SPY). US cyclicals, size, quality, and Asia-Pacific names supplied the relative winners, while low-volatility, developed ex-US income and value, copper miners, and parts of China and Brazil failed to confirm. The 45pp price-relative gap marks a broad price advance with leadership concentrated in US cyclicals, size, and Asia.
Fixed income relative breadth fell to 10 of 16 (62%, -12.5pp), and the winners vs the Aggregate Bonds AGG clustered in international aggregate, EM debt, investment grade, munis, and short duration. Treasuries, TIPS, preferreds, and long duration lagged. The bond split centers on rate sensitivity, with credit participation intact.
Specialty relative breadth rose to 6 of 15 (40%, +13.3pp) vs the S&P 500 SPY, with semiconductors, biotech, infrastructure, momentum, and covered-call equity supplying the winners. Gold GLD and Silver SLV crossed below their 10M MA, while gold miners, crypto, managed futures, and real estate filled the laggard camp. The specialty and commodity mix is selective growth leadership alongside precious-metals deterioration.
10-Month Regime Breadth

Key Takeaways
Silver SLV, up 47.75% over the period, crossed below its 10-month moving average. Its ratio versus SPY also crossed below its 10-month ratio moving average versus SPY. Precious metals sit in a dual price and relative breakdown.
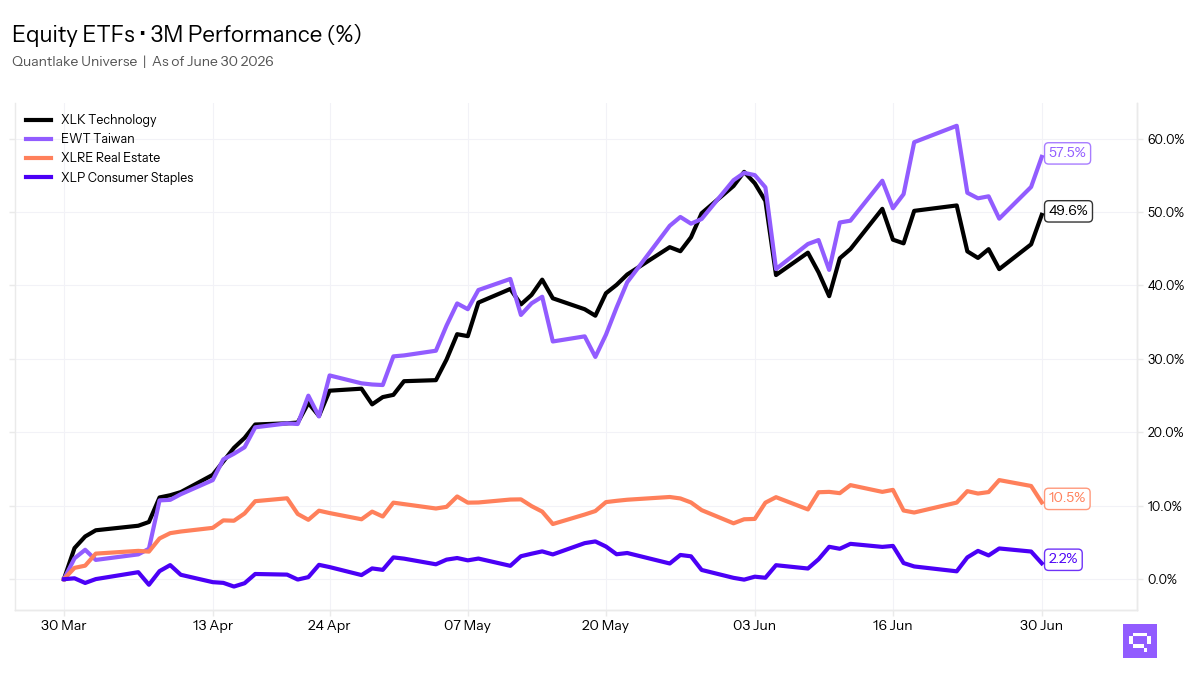
Cross-timescale equity alignment reached 75%, with US equity, emerging markets, Taiwan, South Korea, and the momentum factor holding relative leadership across daily, weekly, and monthly windows. Three sector price crosses framed June: Financials XLF moved above its 10-month moving average, while Communication Services XLC and Consumer Discretionary XLY moved below theirs. The equity rotation centers on financials, size, and selective regional beta.
Fixed income alignment reached 65%, and international aggregate, EM debt, muni, and investment-grade exposures led versus Aggregate Bonds AGG across daily, weekly, and monthly windows. Preferred Stock PFF crossed below both its 10-month moving average and its 10-month ratio moving average versus AGG. The bond profile rewards credit and front-end exposure over Treasury and inflation-linked duration.
FEATURED ETF: iShares Silver SLV

Other Technical Signal Events
EQUITY
↗ Price breakouts (cross-up 10M MA)
XLF - Financial Select Sector · 10M perf: +0.8%
↘ Price breakdowns (cross-down 10M MA)
EWZ - iShares MSCI Brazil ETF · 10M perf: +22.2%
XLY - Consumer Discretionary Select Sector · +2.0%
XLC - Communication Services Select Sector · -2.6%
↗ Leadership gains (cross-up 10M MA vs SPY)
VO - Vanguard Mid-Cap Index ETF · 10M relative perf: -3.7%
RSP - Invesco S&P 500 Equal Weight ETF · -2.0%
MDYV - SPDR S&P 400 Mid Cap Value ETF · -1.6%
DIA - SPDR Dow Jones Industrial Average ETF · -0.8%
QUAL - iShares MSCI USA Quality Factor ETF · +0.2%
VTI - Vanguard Total Stock Market Index ETF · +0.5%
IMTM - iShares MSCI Intl Momentum Factor ETF · +2.6%
VB - Vanguard Small-Cap Index ETF · +3.9%
XLI - Industrial Select Sector · +5.4%
↘ Leadership losses (cross-down 10M MA vs SPY)
COPX - Global X Copper Miners ETF · 10M relative perf: +35.6%
IVLU - iShares Edge MSCI Intl Value Factor ETF · +6.0%
XLE - Energy Select Sector · +3.5%
IDV - iShares International Select Dividend ETF · +2.3%
FIXED INCOME
↗ Price breakouts (cross-up 10M MA)
None for the month
↘ Price breakdowns (cross-down 10M MA)
PFF - iShares Preferred and Income Securities ETF · 10M perf: +1.3%
↗ Leadership gains (cross-up 10M MA vs AGG)
None for the month
↘ Leadership losses (cross-down 10M MA vs AGG)
TIP - iShares TIPS Bond ETF · 10M relative perf: -1.2%
PFF - iShares Preferred and Income Securities ETF · -1.5%
SPECIALTY
↗ Price breakouts (cross-up 10M MA)
None for the month
↘ Price breakdowns (cross-down 10M MA)
GDX - VanEck Gold Miners ETF · 10M perf: +20.3%
GLD - SPDR Gold · +15.8%
↗ Leadership gains (cross-up 10M MA vs SPY)
JEPQ - JPMorgan Nasdaq Equity Premium Income ETF · 10M relative perf: +3.1%
IBB - iShares Biotechnology ETF · +17.9%
↘ Leadership losses (cross-down 10M MA vs SPY)
None for the month
COMMODITIES
↗ Price breakouts (cross-up 10M MA)
None for the month
↘ Price breakdowns (cross-down 10M MA)
SLV - iShares Silver · 10M perf: +47.7%
↗ Leadership gains (cross-up 10M MA vs SPY)
None for the month
↘ Leadership losses (cross-down 10M MA vs SPY)
SLV - iShares Silver · 10M relative perf: +26.2%
PDBC - Invesco Optimum Yield Diversified Commodity Strategy No K-1 ETF · +6.4%
Romain Gandon
CEO, Quantlake
Disclaimer: This article is for informational and educational purposes only and does not constitute investment advice. Past performance is not indicative of future results.