.png)

Intermediate Trends: Equity Leadership Expands Into Size and Taiwan
Broad price participation, selective benchmark outperformance.
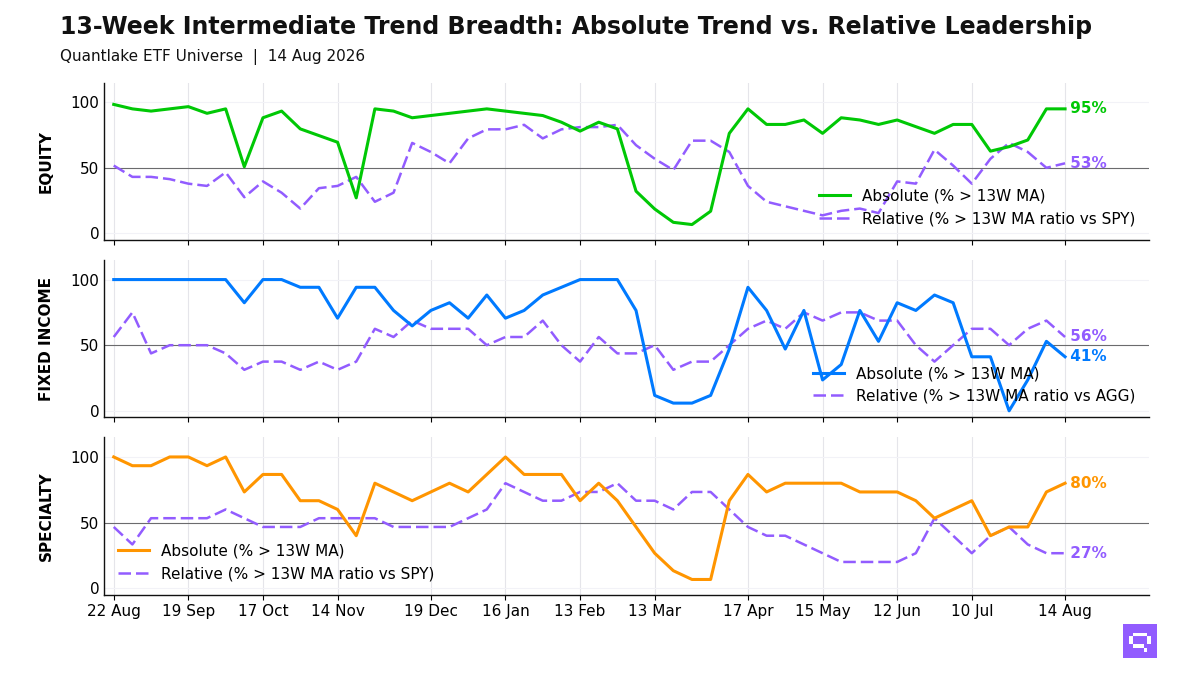
Size and Taiwan moved into the equity leader group by August 14, with 56 of 59 equity ETFs (95%, unchanged on the week) above their 13-week moving average, 13W MA, and 31 of 58 (53%, +3.5pp) above their 13-week ratio moving average versus S&P 500 SPY, 13W ratio MA vs SPY. Low-volatility, Germany, and other ex-US leaders joined that rotation. China equity, United Kingdom equity, and benchmark-like US exposures such as Dow Jones DIA hold above their 13W MA and lag the benchmark; the 41pp price-relative gap leaves price participation far ahead of leadership. The equity regime is broad in price and selective in relative terms, consistent with benchmark-led leadership.
Fixed income leadership is limited to high-yield credit, short duration, preferreds, and intermediate Treasuries, with 7 of 17 ETFs above their 13W MA. Relative to Aggregate Bonds AGG, EM debt and mortgages outperform even though their prices hold below their 13W MA. Investment grade credit and long duration lag. Bond leadership concentrates in credit and shorter maturities; rate-sensitive duration trails.
Specialty leadership versus S&P 500 SPY is limited to biotech and low volatility, even with 12 of 15 ETFs above their 13W MA. Real estate, infrastructure, momentum, and gold hold above their 13W MA and lag the benchmark. Oil and silver crossed above their 13W MA. Broad commodities crossed above their 13W ratio MA versus S&P 500 SPY. Specialty and commodity participation leans toward price recovery, with relative follow-through concentrated in a few names.
13-Week Intermediate Breadth
Key Takeaways
Cross-timescale equity alignment is 92%, with Taiwan EWT, Russell 2000 IWM, and Technology XLK in the relative leader group across daily, weekly, and monthly windows. China Large Cap FXI, Brazil EWZ, and United Kingdom EWU sit on the opposite side. Relative expansion favors Asia-Pacific and US size, while benchmark-like large-cap value lags.
Global Bonds BNDX crossed below its 13W MA and its 13W ratio MA vs Aggregate Bonds AGG, and Corporate Credit VCIT crossed below its 13W ratio MA vs AGG. EM Sovereign Bonds EMB crossed below its 13W MA even as EM debt and mortgages stay in the relative leader group. The bond split runs through credit quality and duration sensitivity.
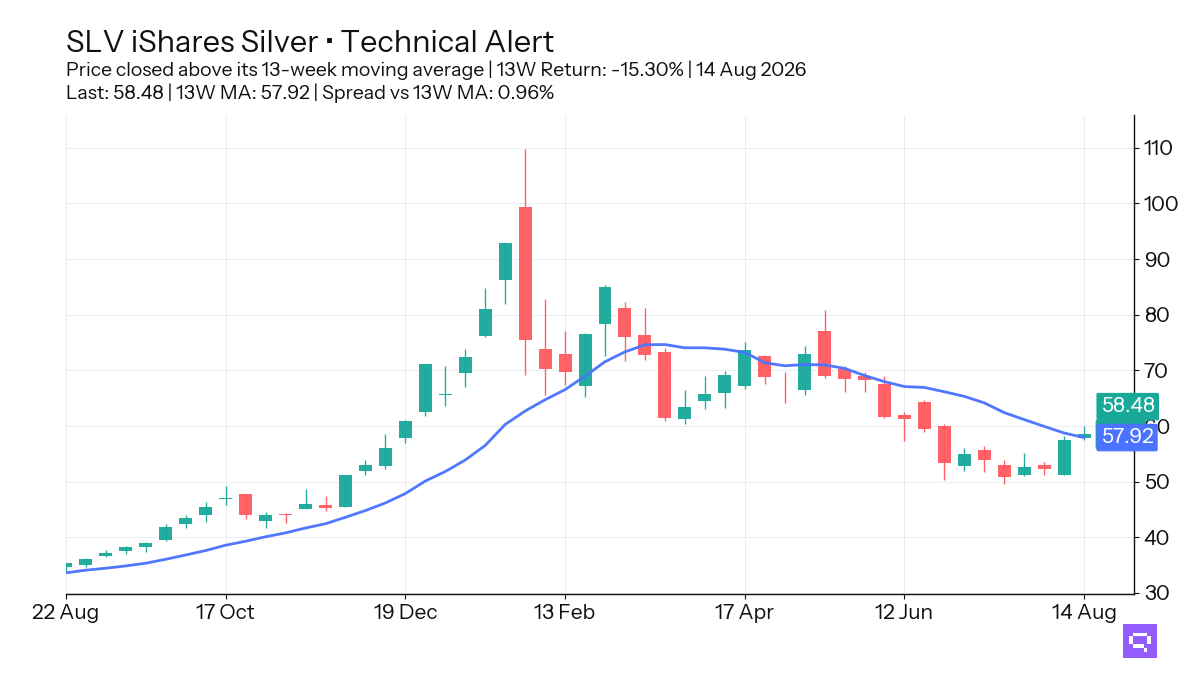
Silver SLV, down 15.30% over the trailing 13-week window, crossed above its 13-week moving average. Oil USO also crossed above its 13W MA, and Broad Commodities PDBC crossed above its 13W ratio MA vs S&P 500 SPY. The commodity cluster shows price recovery in precious metals and energy, with relative improvement concentrated in broad commodities.
FEATURED ETF: iShares Silver SLV
Other Technical Signal Events
Equity: Price vs 13-week MA
| Signal | Ticker | Name | 13W perf |
|---|---|---|---|
| Cross-up | EEM | iShares MSCI Emerging Markets ETF | +2.9% |
| Cross-down | EWZ | iShares MSCI Brazil ETF | -5.5% |
Equity vs SPY: Price Ratio vs 13-week MA
| Signal | Ticker | Name | 13W rel perf |
|---|---|---|---|
| Cross-up | XLE | Energy Select Sector | -0.4% |
| Cross-up | XLK | Technology Select Sector | +2.5% |
| Cross-up | MDYG | SPDR S&P 400 Mid Cap Growth ETF | +2.7% |
| Cross-up | IWM | iShares Russell 2000 ETF | +4.6% |
| Cross-up | DVY | iShares Select Dividend ETF | +4.9% |
| Cross-up | VO | Vanguard Mid-Cap Index ETF | +5.1% |
| Cross-up | VLUE | iShares MSCI USA Value Factor ETF | +8.2% |
| Cross-up | EWT | iShares MSCI Taiwan ETF | +11.4% |
| Cross-down | DIA | SPDR Dow Jones Industrial Average ETF | +3.2% |
| Cross-down | QUAL | iShares MSCI USA Quality Factor ETF | +2.1% |
| Cross-down | VIG | Vanguard Dividend Appreciation Index ETF | +2.0% |
| Cross-down | EWU | iShares MSCI United Kingdom ETF | +2.0% |
| Cross-down | FXI | iShares China Large-Cap ETF | -7.8% |
| Cross-down | MCHI | iShares MSCI China ETF | -7.8% |
Fixed Income: Price vs 13-week MA
| Signal | Ticker | Name | 13W perf |
|---|---|---|---|
| Cross-down | EMB | iShares J.P. Morgan USD Emerging Markets Bond ETF | +1.6% |
| Cross-down | BNDX | Vanguard Total International Bond Index ETF | +1.0% |
Fixed Income vs AGG: Price Ratio vs 13-week MA
| Signal | Ticker | Name | 13W rel perf |
|---|---|---|---|
| Cross-down | BNDX | Vanguard Total International Bond Index ETF | +0.6% |
| Cross-down | VCIT | Vanguard Intermediate-Term Corporate Bond Index ETF | -0.2% |
Specialty: Price vs 13-week MA
| Signal | Ticker | Name | 13W perf |
|---|---|---|---|
| Cross-up | MTUM | iShares MSCI USA Momentum Factor ETF | +6.5% |
Commodities: Price vs 13-week MA
| Signal | Ticker | Name | 13W perf |
|---|---|---|---|
| Cross-up | SLV | iShares Silver | -15.3% |
| Cross-up | USO | United States Oil Fund LP | -14.6% |
Commodities vs SPY: Price Ratio vs 13-week MA
| Signal | Ticker | Name | 13W rel perf |
|---|---|---|---|
| Cross-up | PDBC | Invesco Optimum Yield Diversified Commodity Strategy No K-1 ETF | -8.6% |
Romain Gandon
CEO, Quantlake
Disclaimer: This article is for informational and educational purposes only and does not constitute investment advice. Past performance is not indicative of future results.