.png)

Tactical Trends: Equity Reclaims 20-Day Averages, Leaders Stay Narrow
A 34pp price-relative gap limits confirmation at the close
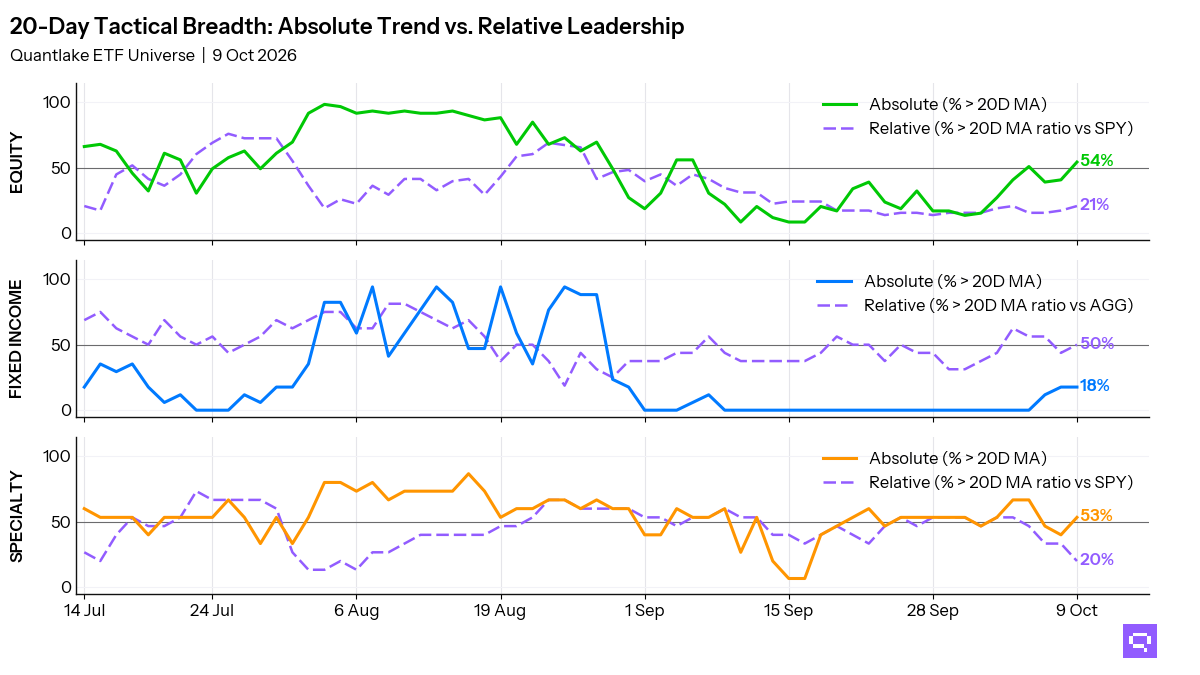
Price participation rebounded across the ETF universe at the October 9 close. 32 of 59 equity ETFs (54%, +13.6pp) hold above their 20-day moving averages (20D MA), and 12 of 58 (21%, +3.5pp) hold above their ratio moving averages vs the S&P 500 SPY. U.S. equity, Japan, and China account for much of the price recovery. Relative leadership concentrates in U.S. growth, energy, and defensive sectors. Developed ex-US, emerging markets, and low-volatility lag the benchmark. The price-relative gap is 34pp.
Fixed income leadership is limited to International Aggregate BNDX and short duration, with 3 of 17 ETFs above their 20-day averages. Short duration has 2 of 2 above their 20-day averages. Long duration has 0 of 1 above its 20-day average. Relative winners vs Aggregate Bonds AGG cluster in intermediate Treasuries, mortgage-backed, and short duration. EM debt, high yield, and preferred lag the benchmark.
Specialty relative leadership vs the S&P 500 SPY is limited to momentum and multi-strategy. Biotechnology and infrastructure reclaimed their 20-day averages. Semiconductors SMH crossed below its ratio moving average. Copper CPER crossed above its 20-day average.
20-Day Tactical Breadth
Key Takeaways
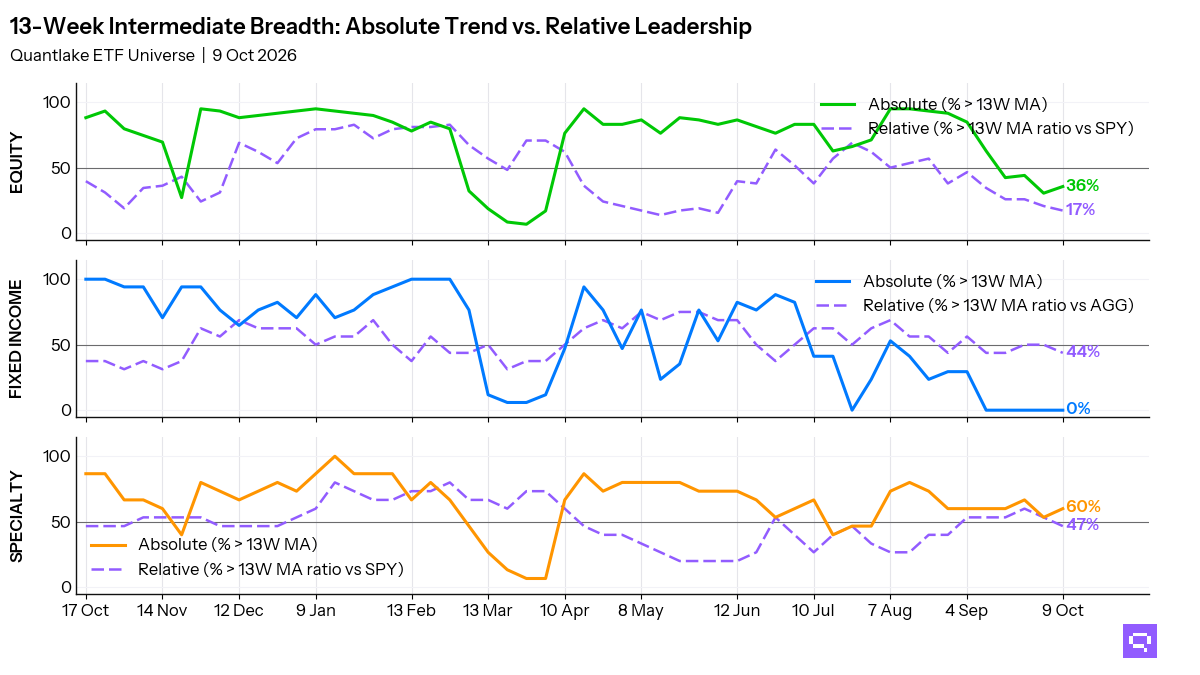
Japan EWJ and China Large Cap FXI crossed above their 20-day averages, and both remain in the relative laggard cluster across the daily, weekly, and monthly windows. Cross-timescale equity alignment is 47%, and many of the new price recoveries lack relative confirmation.
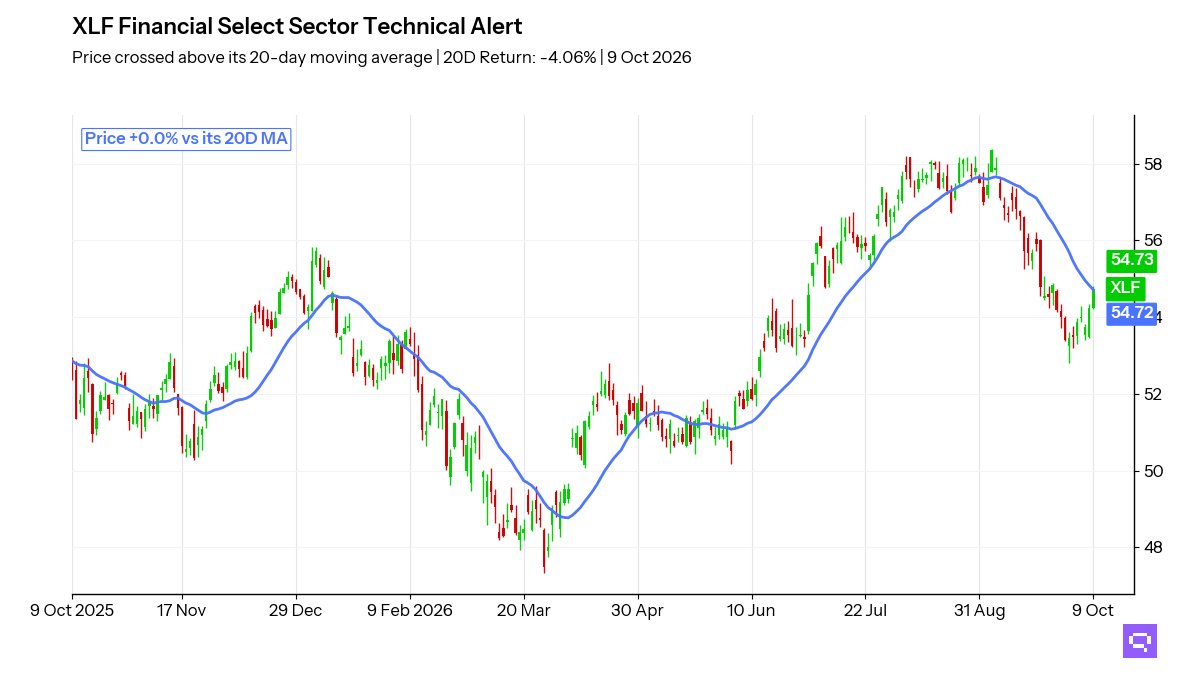
Financials XLF, down 4.06% over the trailing 20-day window, crossed above its 20-day average. Its relative position vs the S&P 500 SPY sits in the laggard cluster across the daily, weekly, and monthly windows.
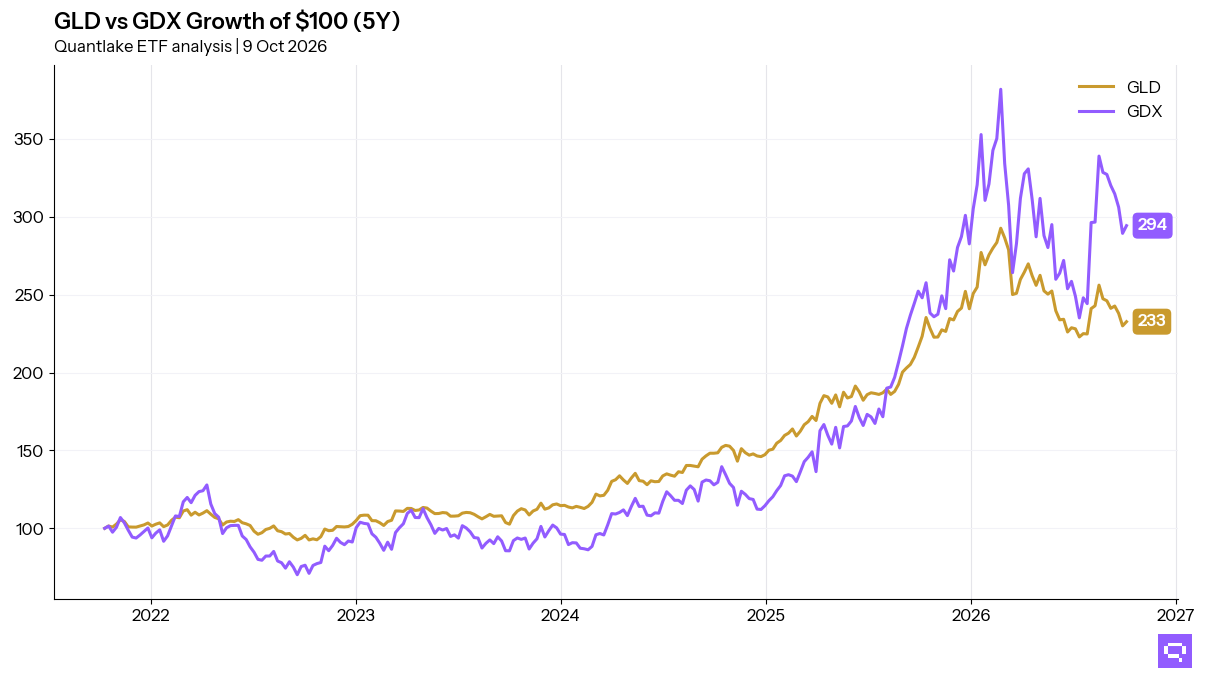
Hard-asset recovery spans equity and commodities. Copper Miners COPX and Copper CPER crossed above their 20-day averages.
Featured ETF: Financial Select Sector XLF
Technical Signals
Equity: Price vs 20-day MA
| Signal | Ticker | Name | 20D perf |
|---|---|---|---|
| Cross-up | XLF | Financial Select Sector | -4.06% |
| Cross-up | COPX | Global X Copper Miners ETF | -3.14% |
| Cross-up | DIA | SPDR Dow Jones Industrial Average ETF | -1.61% |
| Cross-up | XLI | Industrial Select Sector | -1.55% |
| Cross-up | VB | Vanguard Small-Cap Index ETF | -1.06% |
| Cross-up | FXI | iShares China Large-Cap ETF | -0.72% |
| Cross-up | EWJ | iShares MSCI Japan ETF | -0.71% |
| Cross-up | VT | Vanguard Total World Stock Index ETF | +0.19% |
| Cross-up | XLV | Health Care Select Sector | +3.69% |
| Cross-down | SDY | SPDR S&P Dividend ETF | -1.99% |
Equity vs SPY: Price Ratio vs 20-day MA
| Signal | Ticker | Name | 20D rel perf |
|---|---|---|---|
| Cross-up | XLY | Consumer Discretionary Select Sector | -1.96% |
| Cross-up | VO | Vanguard Mid-Cap Index ETF | -1.59% |
Fixed Income vs AGG: Price Ratio vs 20-day MA
| Signal | Ticker | Name | 20D rel perf |
|---|---|---|---|
| Cross-up | MBB | iShares MBS ETF | -0.24% |
Specialty: Price vs 20-day MA
| Signal | Ticker | Name | 20D perf |
|---|---|---|---|
| Cross-up | PAVE | Global X U.S. Infrastructure Development ETF | -1.16% |
| Cross-up | IBB | iShares Biotechnology ETF | +1.76% |
Specialty vs SPY: Price Ratio vs 20-day MA
| Signal | Ticker | Name | 20D rel perf |
|---|---|---|---|
| Cross-up | MTUM | iShares MSCI USA Momentum Factor ETF | +2.26% |
| Cross-down | SMH | VanEck Semiconductor ETF | +3.92% |
| Cross-down | JEPQ | JPMorgan Nasdaq Equity Premium Income ETF | +1.00% |
| Cross-down | FTLS | First Trust Long/Short Equity ETF | -0.37% |
Commodities: Price vs 20-day MA
| Signal | Ticker | Name | 20D perf |
|---|---|---|---|
| Cross-up | CPER | United States Copper LP | +2.88% |
Related
- SPY candlestick signals: forward returns by pattern and sentiment
- Fear and greed: today's market sentiment reading
- ETF trend metrics explained
Romain Gandon
CEO, Quantlake
Disclaimer: This article is for informational and educational purposes only and does not constitute investment advice. Past performance is not indicative of future results.