.png)

Tactical Trends: Defensive Equity Rotation Overtakes Growth Leaders
Price participation exceeds leadership as low-vol and income lead
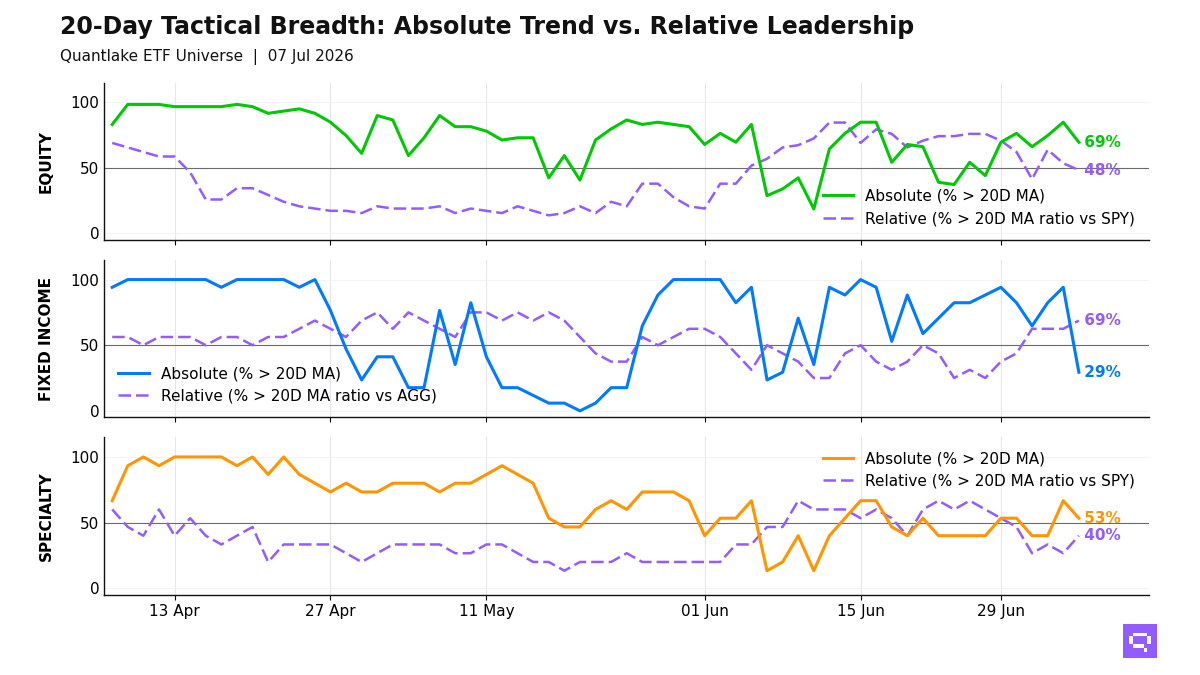
Low-volatility and income leadership marked the July 7 close, with 41 of 59 equity ETFs (69%, -15.2pp on the day) above their 20-day moving average (20D MA) and 28 of 58 (48%, -5.2pp) above their 20-day ratio moving average versus the S&P 500 SPY. Relative winners clustered in defensives, dividends, and real estate. Emerging markets, Asia, and growth lost ground. The 21pp price-relative gap leaves price participation ahead of leadership, consistent with a smaller leadership core than the breadth count alone suggests.
High-yield credit, munis, and short duration led fixed income, with 11 of 16 beating the Aggregate Bonds AGG. EM debt, TIPS, and intermediate Treasuries beat the benchmark from below their 20D MA. Long duration and preferreds lagged. The bond split centers on relative defense and rate sensitivity.
Biotech, REITs, and crypto led specialty leadership, with 6 of 15 beating the S&P 500 SPY. Gold, clean energy, and semiconductors populated the weak cluster. Commodity confirmation is sparse, with 40% cross-timescale alignment, agriculture above its 20D MA, and silver plus broad commodity exposure in the relative laggard bucket. Specialty strength centers on rate-sensitive real assets and select growth niches.
20-Day Tactical Breadth
Key Takeaways
Japan EWJ and Taiwan EWT crossed below their 20D MA and their 20D ratio MA versus the S&P 500 SPY, and developed markets EFA lost relative confirmation in the same session. The equity deterioration concentrates in Asia and developed ex-US beta, with Germany and the United Kingdom holding the relative leader bucket.
TIPS TIP and Short TIPS VTIP crossed above their 20D ratio MA versus Aggregate Bonds AGG after price cross-downs, and 7-10yr Treasuries IEF crossed below its 20D ratio MA versus the benchmark. The bond rotation concentrates in inflation-linked and shorter-duration instruments, with long duration and preferreds at the weak end of the field.
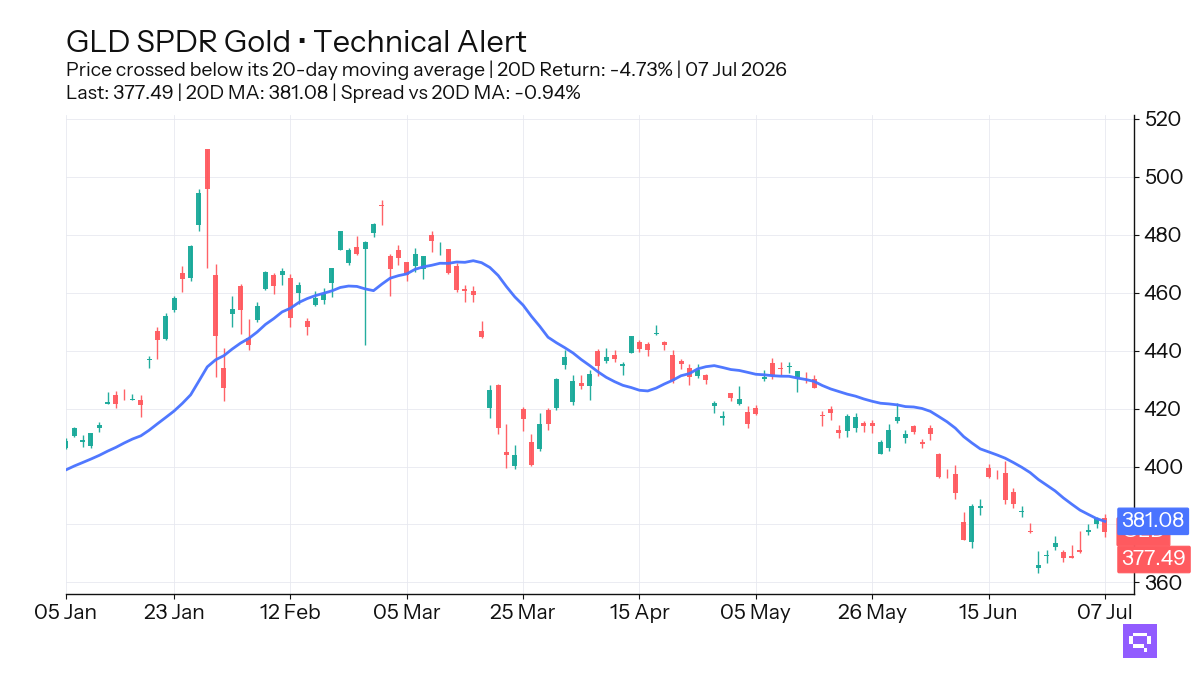
Gold GLD, down 4.73% over the trailing 20-day window, crossed below its 20-day moving average. Real Estate VNQ and Global REITs REET crossed above their 20D ratio MA versus the S&P 500 SPY. Hard-asset leadership sits with REITs; precious metals lag.
FEATURED ETF: SPDR Gold GLD
Other Technical Signal Events
EQUITY
↗ Price breakouts (cross-up 20D MA)
XLRE - The Real Estate Select Sector · 20D perf: +1.30%
↘ Price breakdowns (cross-down 20D MA)
EWT - iShares MSCI Taiwan ETF · 20D perf: +3.87%
EWJ - iShares MSCI Japan ETF · +3.15%
VEA - Vanguard FTSE Developed Markets Index ETF · +2.87%
EEM - iShares MSCI Emerging Markets ETF · +2.28%
IMTM - iShares MSCI Intl Momentum Factor ETF · +2.00%
VWO - Vanguard FTSE Emerging Markets Index ETF · +1.59%
MDYG - SPDR S&P 400 Mid Cap Growth ETF · +1.39%
IYW - iShares U.S. Technology ETF · +0.87%
QQQ - Invesco QQQ · +0.73%
IWF - iShares Russell 1000 Growth ETF · -1.01%
↗ Leadership gains (cross-up 20D MA vs SPY)
XLC - Communication Services Select Sector · 20D relative perf: -1.92%
XLRE - The Real Estate Select Sector · -0.33%
SCHD - Schwab U.S. Dividend Equity ETF · unch.
VYM - Vanguard High Dividend Yield Index ETF · +0.50%
XLP - Consumer Staples Select Sector · +0.77%
XLU - Utilities Select Sector · +2.03%
↘ Leadership losses (cross-down 20D MA vs SPY)
IWM - iShares Russell 2000 ETF · 20D relative perf: +3.71%
IQLT - iShares MSCI Intl Quality Factor ETF · +2.53%
INDA - iShares MSCI India ETF · +2.52%
VB - Vanguard Small-Cap Index ETF · +2.21%
EWT - iShares MSCI Taiwan ETF · +2.20%
EFA - iShares MSCI EAFE ETF · +1.80%
EWJ - iShares MSCI Japan ETF · +1.48%
VEA - Vanguard FTSE Developed Markets Index ETF · +1.21%
IVLU - iShares Edge MSCI Intl Value Factor ETF · +0.85%
FIXED INCOME
↗ Price breakouts (cross-up 20D MA)
None on the close
↘ Price breakdowns (cross-down 20D MA)
EMB - iShares J.P. Morgan USD Emerging Markets Bond ETF · 20D perf: +0.98%
MBB - iShares MBS ETF · +0.47%
VCIT - Vanguard Intermediate-Term Corporate Bond Index ETF · +0.45%
IEF - iShares 7-10 Year Treasury Bond ETF · +0.42%
VGIT - Vanguard Intermediate-Term Treasury Index ETF · +0.41%
IEI - iShares 3-7 Year Treasury Bond ETF · +0.40%
BNDX - Vanguard Total International Bond Index ETF · +0.25%
LQD - iShares iBoxx $ Investment Grade Corporate Bond ETF · unch.
TIP - iShares TIPS Bond ETF · unch.
PFF - iShares Preferred and Income Securities ETF · -0.83%
↗ Leadership gains (cross-up 20D MA vs AGG)
TIP - iShares TIPS Bond ETF · 20D relative perf: -0.40%
VTIP - Vanguard Short-Term Inflation-Protected Securities Index ETF · -0.35%
↘ Leadership losses (cross-down 20D MA vs AGG)
IEF - iShares 7-10 Year Treasury Bond ETF · 20D relative perf: unch.
SPECIALTY
↗ Price breakouts (cross-up 20D MA)
None on the close
↘ Price breakdowns (cross-down 20D MA)
JEPQ - JPMorgan Nasdaq Equity Premium Income ETF · 20D perf: +1.77%
GLD - SPDR Gold · -4.73%
↗ Leadership gains (cross-up 20D MA vs SPY)
VNQ - Vanguard Real Estate Index ETF · 20D relative perf: +0.91%
REET - iShares Global REIT ETF · +2.51%
↘ Leadership losses (cross-down 20D MA vs SPY)
None on the close
COMMODITIES
No event on the close
Romain Gandon
CEO, Quantlake
Disclaimer: This article is for informational and educational purposes only and does not constitute investment advice. Past performance is not indicative of future results.