.png)

Tactical Trends: Emerging Markets and Growth Lead Equity Breadth Expansion
Only 12 of 58 equity ETFs beat the S&P 500 SPY, a 20pp gap to price breadth
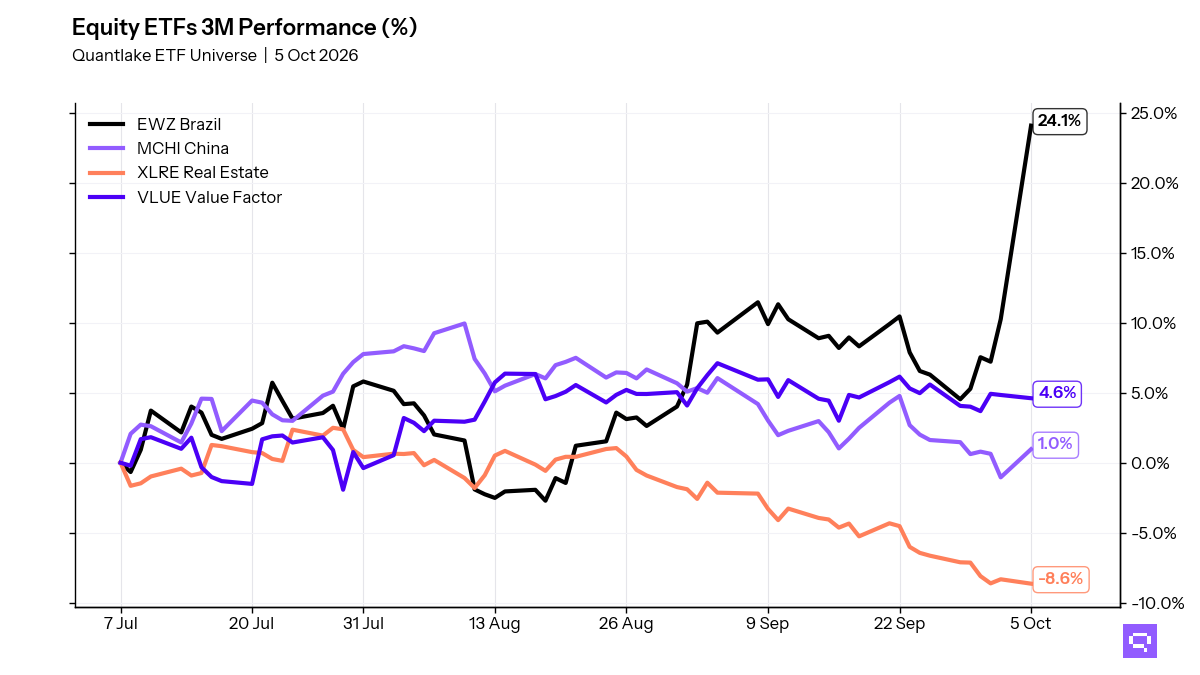
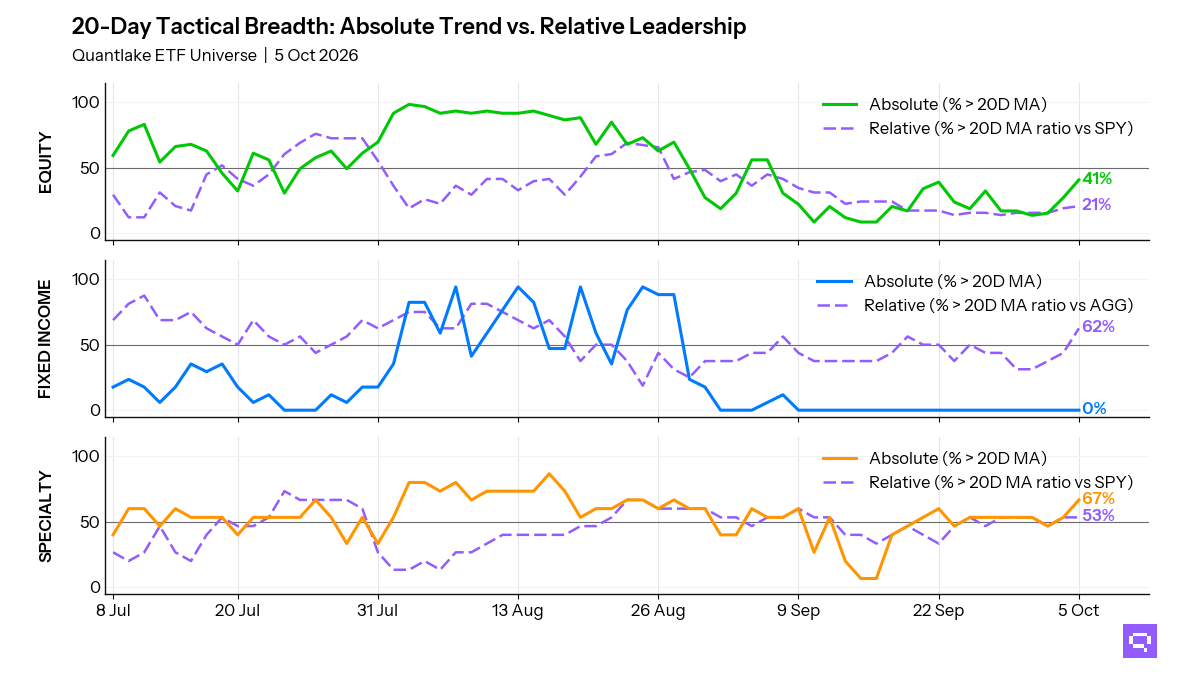
Emerging markets and growth led the equity advance at the close on October 5, with 24 of 59 ETFs (41%, +13.6pp on the day) above their 20-day moving average (20D MA). Only 12 of 58 (21%, +1.7pp) beat the S&P 500 SPY, leaving a 20pp price-relative gap. Emerging-market equity contributes five relative leaders. US growth contributes five price leaders. Low-volatility, developed ex-US, and value still dominate the laggard side.
Fixed income stays entirely below price trend, with 0 of 17 above their 20D MA. Relative winners vs the Aggregate Bonds AGG are concentrated in High Yield HYG and High Yield Bonds JNK, short duration VCSH and VTIP, and intermediate Treasuries. Short duration contributes two leaders. Long duration contributes one laggard in TLT. EM debt and investment grade also sit below the benchmark.
Specialty leadership centers on crypto-linked names, semiconductors, and momentum, with 10 of 15 above their 20D MA. Precious metals, clean energy, and REITs trail the S&P 500 SPY. Commodity weakness is concentrated in silver SLV on price and in copper CPER and agriculture DBA on a relative basis.
20-Day Tactical Breadth
Key Takeaways
Equity alignment reaches 53% across daily, weekly, and monthly measures. Emerging-market equity, Asia-Pacific, Brazil, and US growth occupy both absolute and relative leader sets across those horizons. Low-volatility, developed ex-US, China, India, and value fill much of the opposing side.
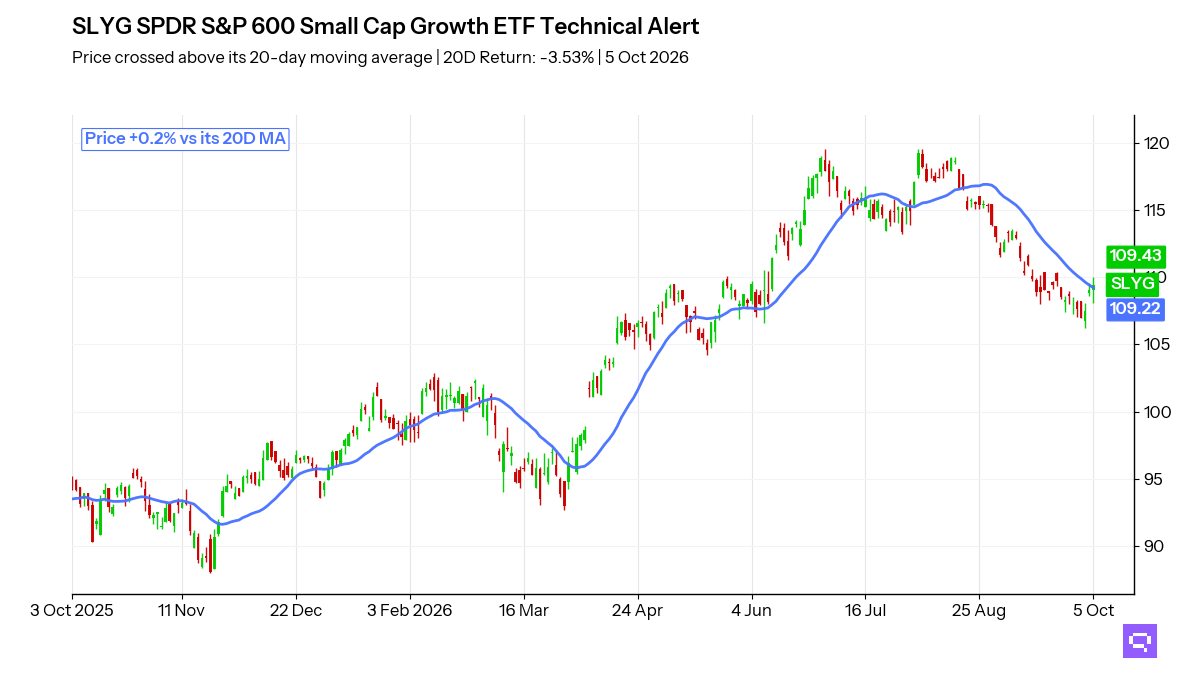
S&P SmallCap Growth SLYG fell 3.53% over the trailing 20-day window and crossed above its 20D MA. SLYG stays price-positive and benchmark-negative, with price above its MA and ratio below its ratio MA vs the S&P 500 SPY.
High Yield HYG rose 0.30% over the trailing 20-day window and crossed above its 20-day ratio MA vs the Aggregate Bonds AGG. High Yield Bonds JNK rose 0.30% over the trailing 20-day window and crossed above its 20-day ratio MA vs AGG. TIPS TIP fell 0.19% over the trailing 20-day window and crossed above its ratio MA vs AGG.
Featured ETF: SPDR S&P 600 Small Cap Growth ETF SLYG
Technical Signals
Equity: Price vs 20-day MA
| Signal | Ticker | Name | 20D perf |
|---|---|---|---|
| Cross-up | SLYG | SPDR S&P 600 Small Cap Growth ETF | -3.53% |
| Cross-up | VB | Vanguard Small-Cap Index ETF | -2.73% |
| Cross-up | XLI | Industrial Select Sector | -2.69% |
| Cross-up | VO | Vanguard Mid-Cap Index ETF | -2.10% |
| Cross-up | IMTM | iShares MSCI Intl Momentum Factor ETF | -2.03% |
| Cross-up | VWO | Vanguard FTSE Emerging Markets Index ETF | -1.16% |
| Cross-up | JEPI | JPMorgan Equity Premium Income ETF | -1.02% |
| Cross-up | XLE | Energy Select Sector | -0.36% |
Equity vs SPY: Price Ratio vs 20-day MA
| Signal | Ticker | Name | 20D rel perf |
|---|---|---|---|
| Cross-up | EEM | iShares MSCI Emerging Markets ETF | -0.80% |
Fixed Income vs AGG: Price Ratio vs 20-day MA
| Signal | Ticker | Name | 20D rel perf |
|---|---|---|---|
| Cross-up | TIP | iShares TIPS Bond ETF | -0.19% |
| Cross-up | JNK | SPDR Bloomberg High Yield Bond ETF | +0.30% |
| Cross-up | HYG | iShares iBoxx $ High Yield Corporate Bond ETF | +0.30% |
Specialty: Price vs 20-day MA
| Signal | Ticker | Name | 20D perf |
|---|---|---|---|
| Cross-up | IBB | iShares Biotechnology ETF | -1.86% |
| Cross-up | USMV | iShares MSCI USA Min Vol Factor ETF | -1.48% |
Related
- SPY candlestick signals: forward returns by pattern and sentiment
- Fear and greed: today's market sentiment reading
- ETF trend metrics explained
Romain Gandon
CEO, Quantlake
Disclaimer: This article is for informational and educational purposes only and does not constitute investment advice. Past performance is not indicative of future results.