



Tactical Market Trends: International Equity Leadership Slips
Only 28 of 58 equity ETFs beat SPY, down 12.1pp at the close.
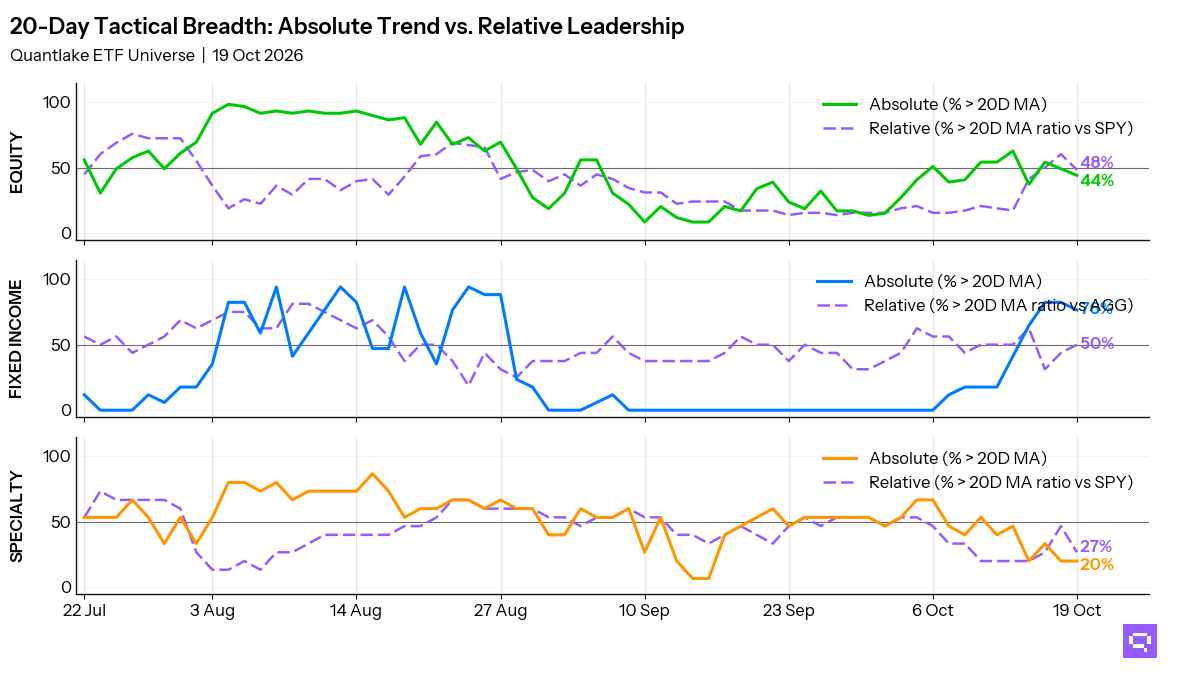
Relative winners thinned across international equity at the close on October 19, with 26 of 59 ETFs (44%, -5.1pp on the session) above their 20-day moving average (20D MA) and 28 of 58 ETFs (48%, -12.1pp on the session) above their ratio MA vs S&P 500 SPY. The 14 relative leaders cluster in low-volatility, quality, dividend, and equal-weight exposures, plus United Kingdom EWU and Brazil EWZ. The 16 laggards cluster in developed ex-US, emerging Asia, small caps, and growth-heavy US exposure. The price-relative gap is -4pp.
Fixed income leadership favors Treasuries, TIPS, munis, and mortgages vs Aggregate Bonds AGG. Eight laggards concentrate in EM debt, credit, and preferreds. Short-duration breadth is 2 of 2 above their price MA and 1 of 2 above their ratio MA. Long-duration breadth is 1 of 1 on both measures.
Specialty leadership is limited to three price leaders and four relative winners vs S&P 500 SPY, led by Managed Futures DBMF, low-volatility, and REIT exposure. Gold GLD and agriculture lost relative ground vs S&P 500 SPY. Cross-timescale commodity strength stays concentrated in broad commodities and oil.
20-Day Tactical Breadth
Key Takeaways
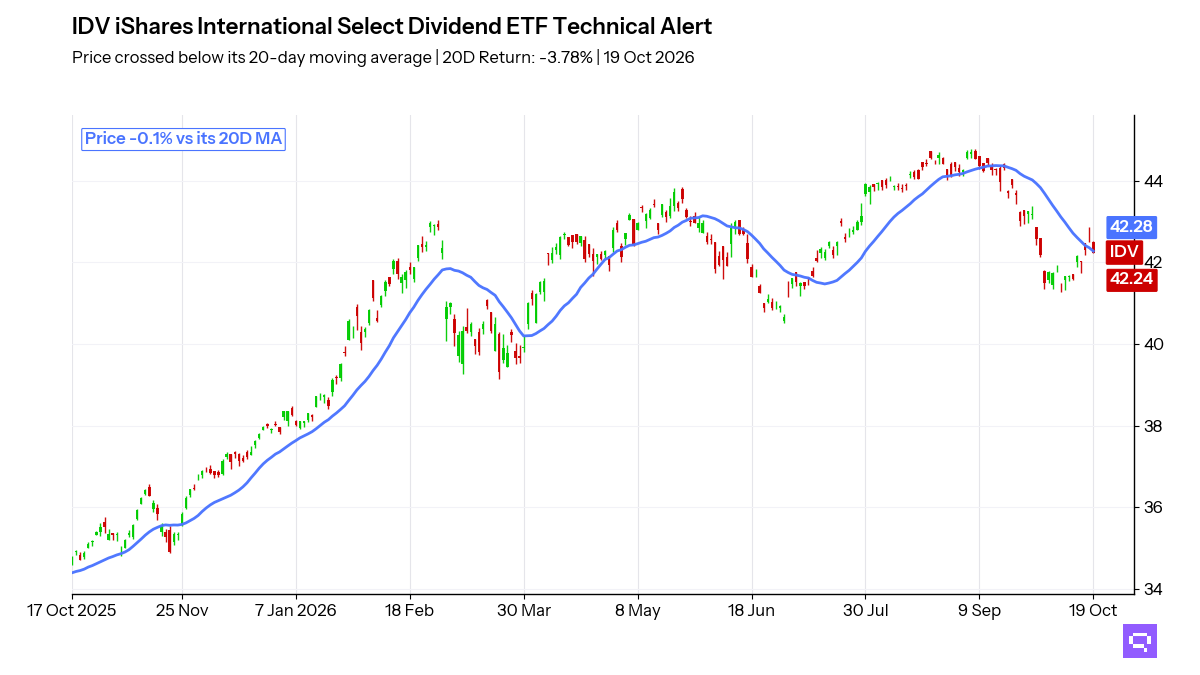
Intl High Dividend IDV, down 3.78% over the trailing 20-day window, crossed below its 20D MA. IDV and Europe VGK are below their price MA and above their ratio MA vs S&P 500 SPY.
3-7yr Treasuries IEI and Short TIPS VTIP crossed above their ratio MA vs Aggregate Bonds AGG. Investment Grade Credit LQD crossed below its ratio MA, and EM Sovereign Bonds EMB crossed below its 20D MA.
Managed Futures DBMF crossed above its 20D MA. Global REITs REET crossed below its 20D MA and its ratio MA vs S&P 500 SPY, and Agriculture Basket DBA crossed below its ratio MA vs S&P 500 SPY.
Featured ETF: iShares International Select Dividend ETF IDV
Technical Signals
Equity: Price vs 20-day MA
| Signal | Ticker | Name | 20D perf |
|---|---|---|---|
| Cross-down | VGK | Vanguard FTSE Europe Index ETF | -3.15% |
| Cross-down | EWG | iShares MSCI Germany ETF | -3.66% |
| Cross-down | IDV | iShares International Select Dividend ETF | -3.78% |
Equity vs SPY: Price Ratio vs 20-day MA
| Signal | Ticker | Name | 20D rel perf |
|---|---|---|---|
| Cross-down | URTH | iShares MSCI World ETF | -0.55% |
| Cross-down | XLI | Industrial Select Sector | -1.04% |
| Cross-down | SLYV | SPDR S&P 600 Small Cap Value ETF | -1.32% |
| Cross-down | EFA | iShares MSCI EAFE ETF | -2.18% |
| Cross-down | EWG | iShares MSCI Germany ETF | -2.78% |
| Cross-down | FXI | iShares China Large-Cap ETF | -3.07% |
| Cross-down | IVLU | iShares Edge MSCI Intl Value Factor ETF | -3.39% |
Fixed Income: Price vs 20-day MA
| Signal | Ticker | Name | 20D perf |
|---|---|---|---|
| Cross-down | EMB | iShares J.P. Morgan USD Emerging Markets Bond ETF | -2.39% |
Fixed Income vs AGG: Price Ratio vs 20-day MA
| Signal | Ticker | Name | 20D rel perf |
|---|---|---|---|
| Cross-up | IEI | iShares 3-7 Year Treasury Bond ETF | +0.72% |
| Cross-up | VTIP | Vanguard Short-Term Inflation-Protected Securities Index ETF | +1.27% |
| Cross-down | LQD | iShares iBoxx $ Investment Grade Corporate Bond ETF | -0.90% |
Specialty: Price vs 20-day MA
| Signal | Ticker | Name | 20D perf |
|---|---|---|---|
| Cross-up | DBMF | iMGP DBi Managed Futures Strategy ETF | +3.30% |
| Cross-down | REET | iShares Global REIT ETF | -3.25% |
Specialty vs SPY: Price Ratio vs 20-day MA
| Signal | Ticker | Name | 20D rel perf |
|---|---|---|---|
| Cross-down | PAVE | Global X U.S. Infrastructure Development ETF | +0.33% |
| Cross-down | REET | iShares Global REIT ETF | -2.36% |
| Cross-down | GLD | SPDR Gold | -3.82% |
Commodities vs SPY: Price Ratio vs 20-day MA
| Signal | Ticker | Name | 20D rel perf |
|---|---|---|---|
| Cross-down | DBA | Invesco DB Agriculture | -0.77% |
Related
- SPY candlestick signals: forward returns by pattern and sentiment
- Fear and greed: today's market sentiment reading
- ETF trend metrics explained
Romain Gandon
CEO, Quantlake
Disclaimer: This article is for informational and educational purposes only and does not constitute investment advice. Past performance is not indicative of future results.


