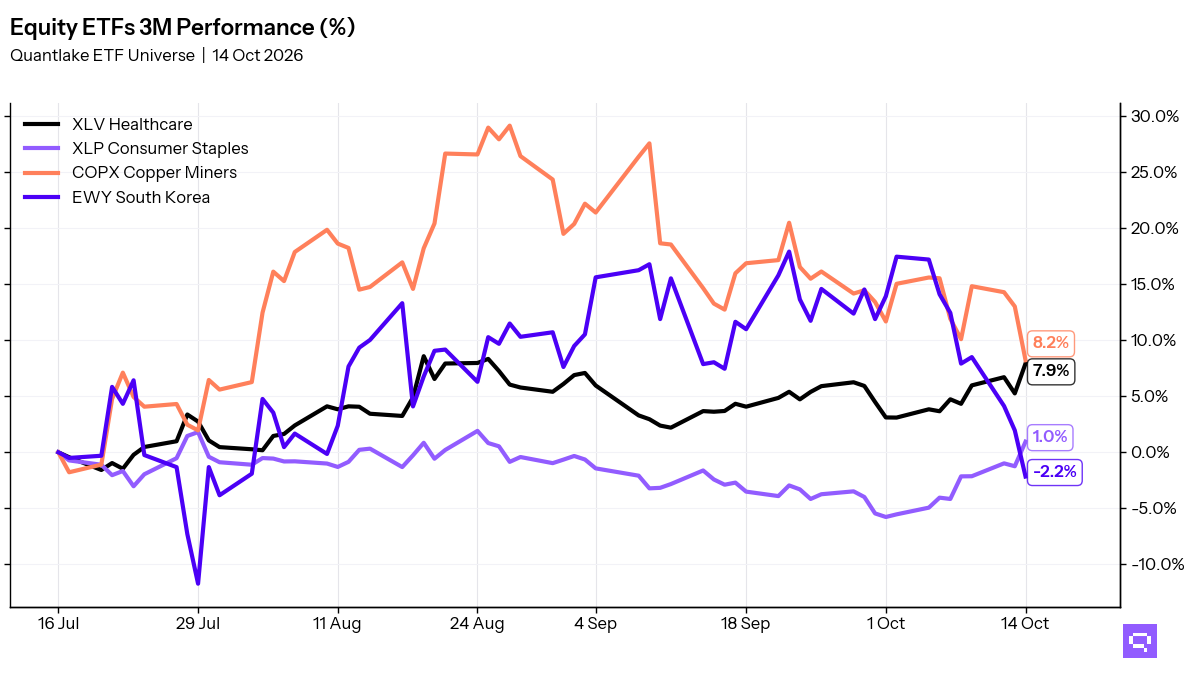
.png)

Tactical Market Trends: Growth Leadership Fades vs SPY
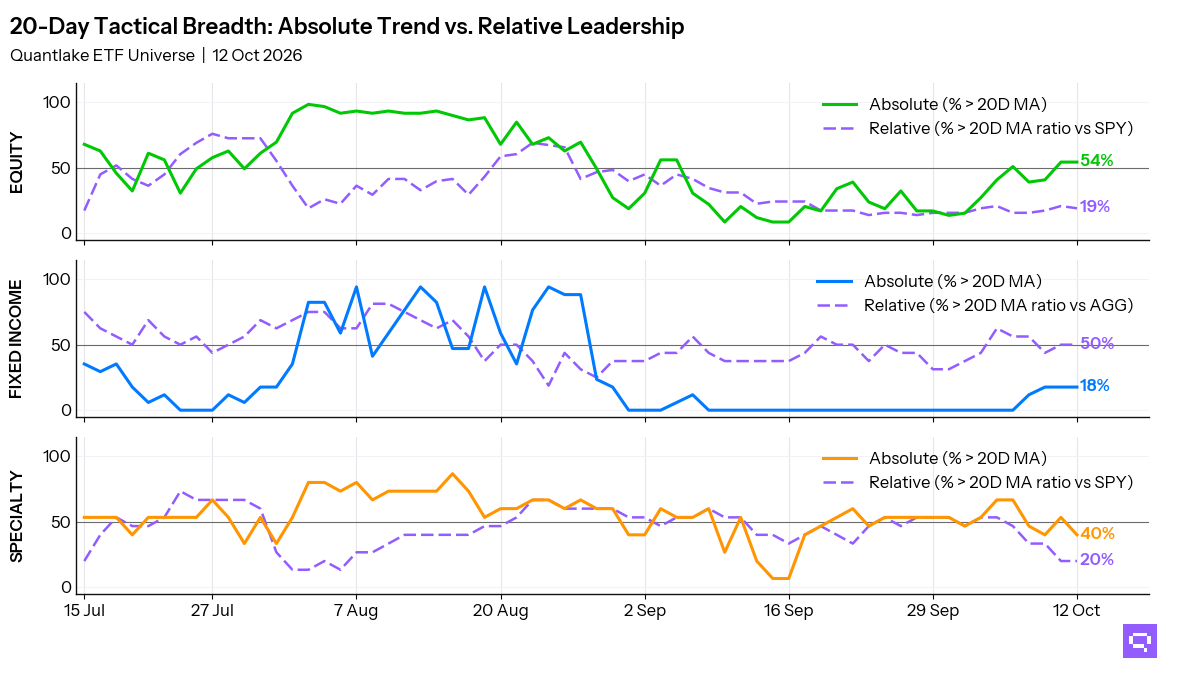
Only 11 of 58 equity ETFs lead SPY, a 35pp gap to price breadth
Relative leadership thins at the October 12 close. Only 11 of 58 equity ETFs (19%, -1.7pp on the day) are above their ratio MAs vs the S&P 500 SPY, and 32 of 59 (54%, unchanged on the day) are above their 20-day averages. A 35pp price-relative gap separates participation from leadership. The relative winners cluster in healthcare, utilities, energy, dividend growth, and Brazil. Technology XLK and Nasdaq 100 QQQ crossed below their ratio MAs.
Fixed income leadership is limited to International Aggregate BNDX and short duration. Short-duration names are 2 of 2 above their 20-day averages. Long duration is 0 of 1. Government duration plus mortgages outperform the Aggregate Bonds AGG from below their price averages.
Specialty price breadth fell to 6 of 15 ETFs (40%, -13pp on the day). Long/Short Equity FTLS crossed above its ratio MA vs the S&P 500 SPY. Leadership is otherwise limited to managed futures and low volatility. Semiconductors SMH and other growth-linked specialty names fill the laggard cluster. Oil turned back above its 20-day average. Copper regained relative strength vs SPY.
20-Day Tactical Breadth
Key Takeaways
Dividend ETFs rotated higher in price. Select Dividend DVY, Dividend Quality SCHD, Dividend Aristocrats SDY, and Real Estate XLRE crossed above their 20-day averages. Covered Calls S&P JEPI, Dividend Growth VIG, and Healthcare XLV crossed above their ratio MAs vs the S&P 500 SPY.
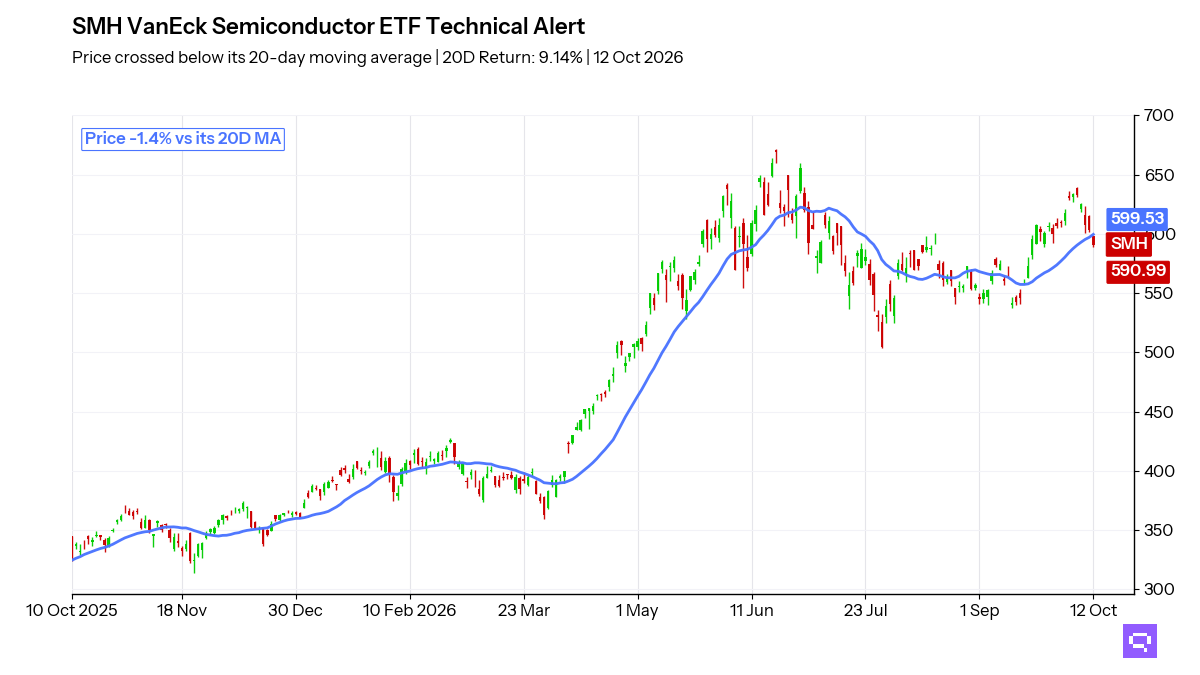
Semiconductors SMH, up 9.14% over the trailing 20-day window, crossed below its 20-day moving average (20D MA). Momentum Factor MTUM crossed below its 20-day average and below its ratio MA vs the S&P 500 SPY. Real Estate VNQ crossed above its 20-day average. Its ratio MA vs the benchmark stays below.
International Aggregate BNDX, short duration, and intermediate Treasuries lead vs Aggregate Bonds AGG across daily, weekly, and monthly measures. Copper CPER and Broad Commodities PDBC crossed above their ratio MAs vs SPY. Oil USO crossed above its 20-day average.
Featured ETF: VanEck Semiconductor ETF SMH
Technical Signals
Equity: Price vs 20-day MA
| Signal | Ticker | Name | 20D perf |
|---|---|---|---|
| Cross-up | DVY | iShares Select Dividend ETF | -3.55% |
| Cross-up | SCHD | Schwab U.S. Dividend Equity ETF | -2.37% |
| Cross-up | XLRE | The Real Estate Select Sector | -1.97% |
| Cross-up | SDY | SPDR S&P Dividend ETF | -1.71% |
| Cross-down | XLI | Industrial Select Sector | -0.19% |
| Cross-down | EWJ | iShares MSCI Japan ETF | -0.27% |
| Cross-down | COPX | Global X Copper Miners ETF | -0.32% |
| Cross-down | VB | Vanguard Small-Cap Index ETF | -1.15% |
Equity vs SPY: Price Ratio vs 20-day MA
| Signal | Ticker | Name | 20D rel perf |
|---|---|---|---|
| Cross-up | VIG | Vanguard Dividend Appreciation Index ETF | -1.47% |
| Cross-up | JEPI | JPMorgan Equity Premium Income ETF | -1.08% |
| Cross-up | XLV | Health Care Select Sector | +0.39% |
| Cross-down | XLK | Technology Select Sector | +4.06% |
| Cross-down | IYW | iShares U.S. Technology ETF | +3.66% |
| Cross-down | QQQ | Invesco QQQ | +2.72% |
| Cross-down | IWF | iShares Russell 1000 Growth ETF | +2.36% |
Specialty: Price vs 20-day MA
| Signal | Ticker | Name | 20D perf |
|---|---|---|---|
| Cross-up | VNQ | Vanguard Real Estate Index ETF | -2.31% |
| Cross-down | SMH | VanEck Semiconductor ETF | +9.14% |
| Cross-down | MTUM | iShares MSCI USA Momentum Factor ETF | +5.35% |
| Cross-down | IBB | iShares Biotechnology ETF | -0.16% |
Specialty vs SPY: Price Ratio vs 20-day MA
| Signal | Ticker | Name | 20D rel perf |
|---|---|---|---|
| Cross-up | FTLS | First Trust Long/Short Equity ETF | unch. |
| Cross-down | MTUM | iShares MSCI USA Momentum Factor ETF | +2.76% |
Commodities: Price vs 20-day MA
| Signal | Ticker | Name | 20D perf |
|---|---|---|---|
| Cross-up | USO | United States Oil Fund LP | -3.59% |
Commodities vs SPY: Price Ratio vs 20-day MA
| Signal | Ticker | Name | 20D rel perf |
|---|---|---|---|
| Cross-up | PDBC | Invesco Optimum Yield Diversified Commodity Strategy No K-1 ETF | -2.06% |
| Cross-up | CPER | United States Copper LP | +3.59% |
Related
- SPY candlestick signals: forward returns by pattern and sentiment
- Fear and greed: today's market sentiment reading
- ETF trend metrics explained
Romain Gandon
CEO, Quantlake
Disclaimer: This article is for informational and educational purposes only and does not constitute investment advice. Past performance is not indicative of future results.