


.png)

EWJ Japan Equity ETF: 8.5% Above Its Rising 10-Month SMA
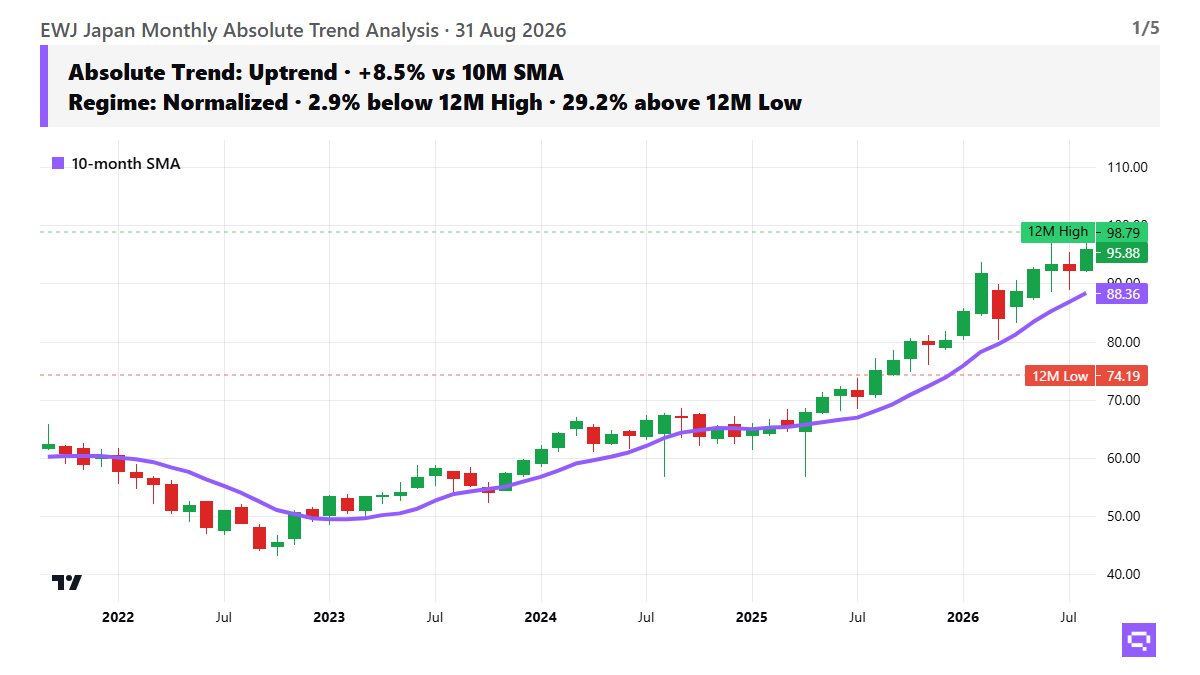
EWJ holds +8.5% above its rising 10-month SMA; a close above its $98.79 August high would extend the uptrend; DXY linkage is a limited headwind.
Trend & Momentum
iShares MSCI Japan ETF holds a firm long-term uptrend, trading at $95.88, 8.5% above its 10-month SMA at $88.36, with its average up 5.9% over three months. EWJ has held above its 10-month SMA since April 2025. The advance accelerated, with recent 3M at +3.7pp versus the prior 3-6M leg at +0.7%; 6M is +4.4%, 12M is +27.8%, and 1M at +3.8% adds to the recent push. Over the past 12 months, EWJ set its 12-month low at $74.19 on September 2025 and reached a new 12-month high of $98.79 on August; the upward sequence is intact after a 2.9% close below that peak. 1Y realized volatility is 15.0% against the 3Y average of 12.4% (z-score 1.2). Higher volatility sits alongside an intact uptrend. The setup depends on price holding above its rising average rather than muted swings.
Relative Strength & Market Sensitivity
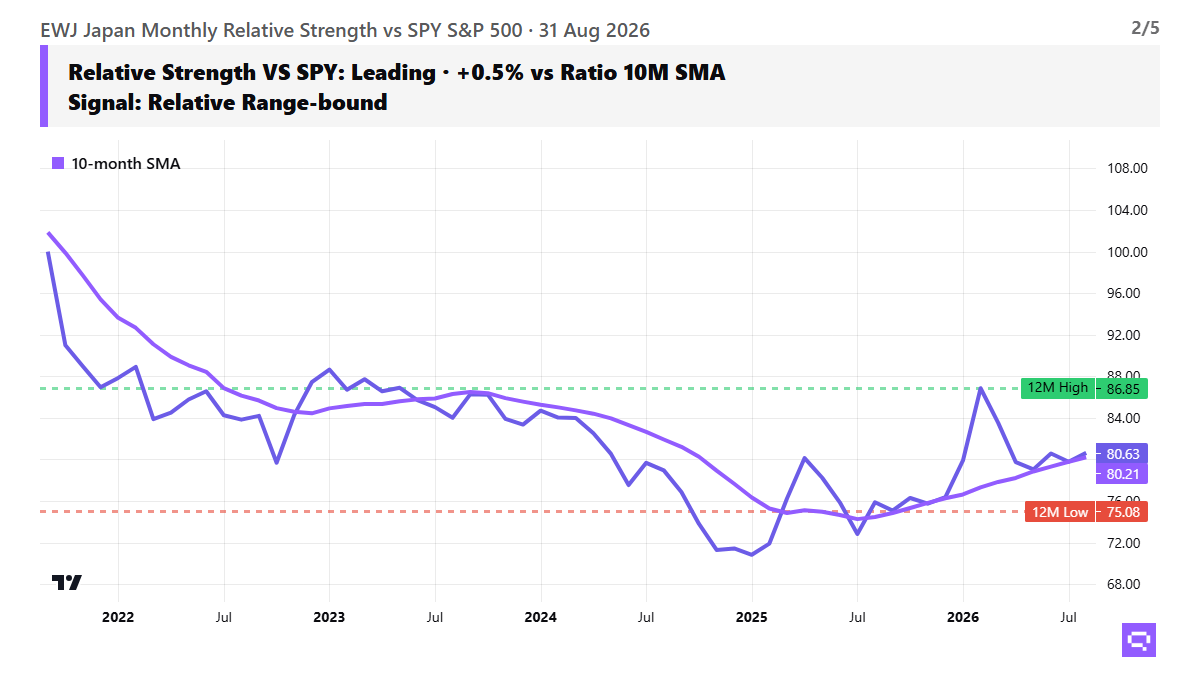
EWJ trails SPY over the full cycle even as relative strength firmed near the margin: the EWJ/SPY ratio, indexed to 100 at September 2021, stands 0.5% above its 10-month ratio SMA, with its ratio average up 1.7% over three months, and trails by 19.4% since the base. Recent relative performance cooled toward flat, with excess return at +1.1% over 1M, +2.0% over 3M, and +6.3% over 12M. After its 12-month ratio low on September 2025, the ratio stood 7.4% above that trough and 7.2% below its 12-month high set on February. Relative leadership cooled toward flat. The ratio is stabilizing rather than extending a clear leadership trend.
Risk & Macro Sensitivity
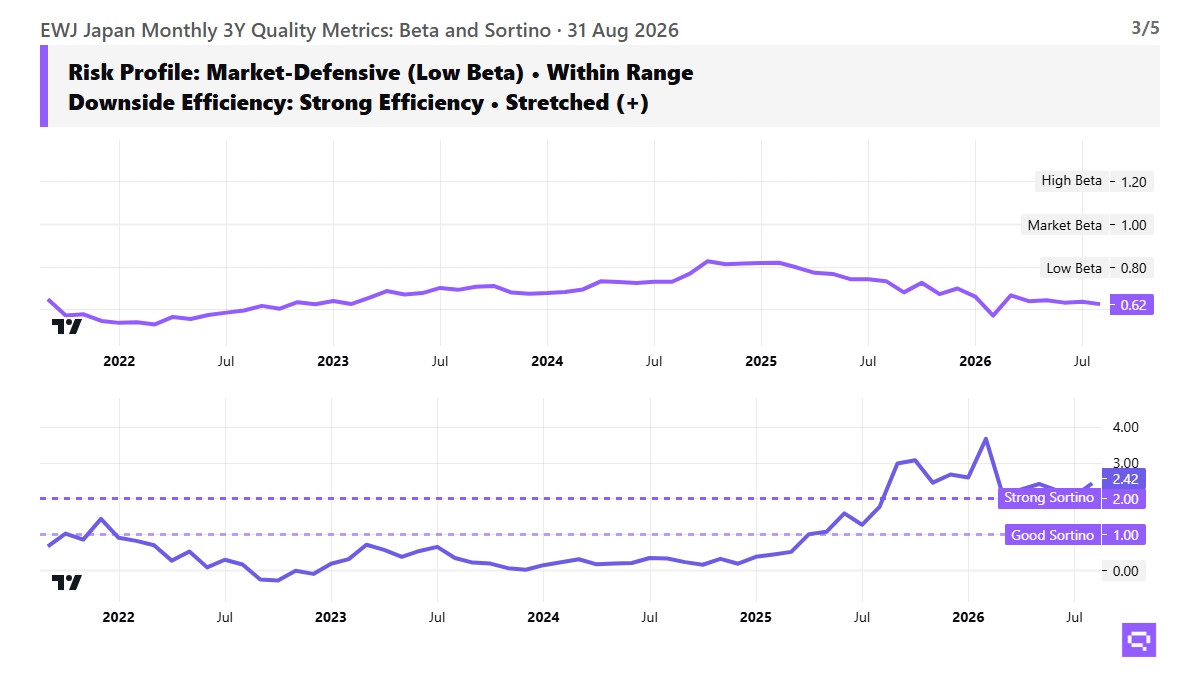
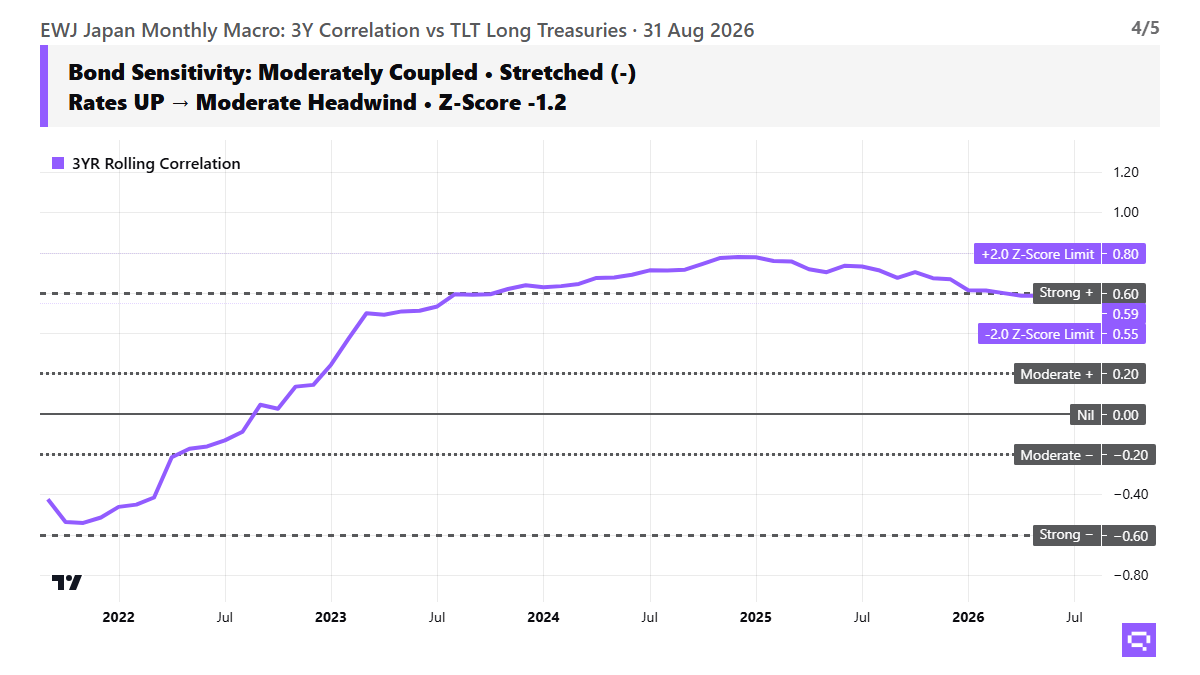
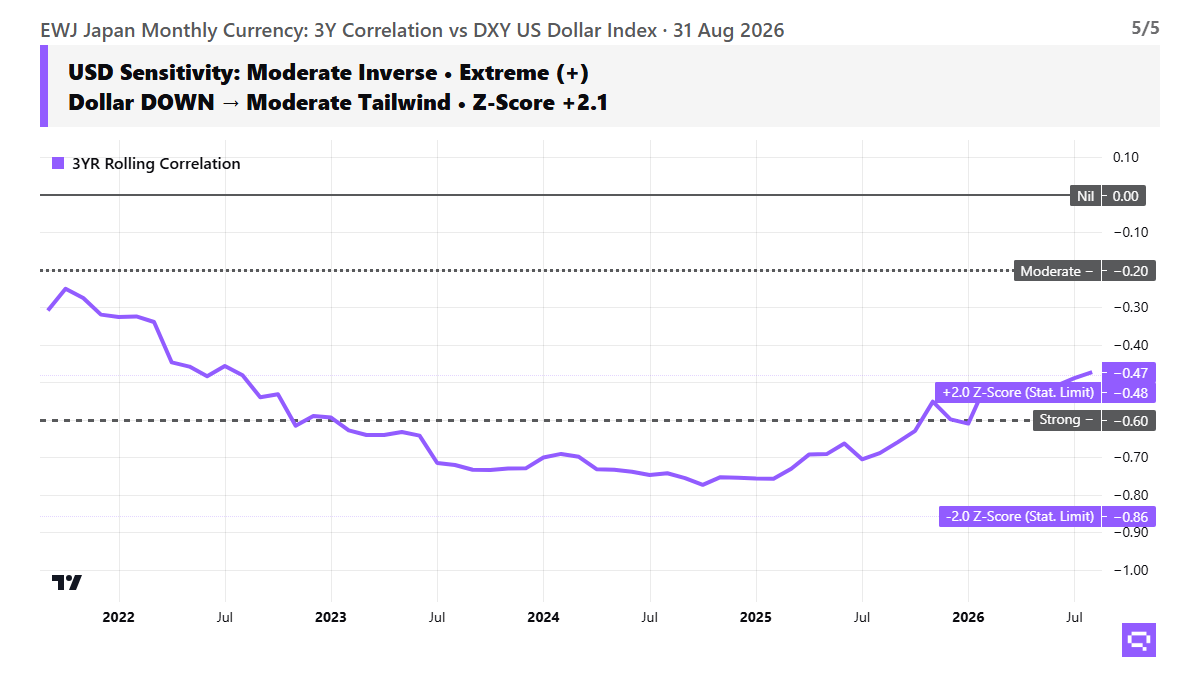
EWJ pairs defensive market sensitivity with strong downside-adjusted returns, with 3Y beta at 0.62 and 3Y Sortino at 2.42. On the rate side, EWJ's 3Y correlation to Long Treasuries TLT is 0.59. TLT stands 2.9% below its 10-month SMA, so the rate backdrop is a moderate headwind. On the dollar side, EWJ's 3Y correlation to the US Dollar Index DXY is -0.47. DXY stands 0.5% above its 10-month SMA, which adds a limited headwind. Risk structure is defensive and efficient over the cycle.
Related
- ETF trend metrics explained: definitions for every measure used above
- Compare ETFs with the Sharpe ratio
- SPY vs RSP: cap-weight vs equal-weight
- GLD vs GDX: bullion vs miners
- MTUM vs QUAL: momentum vs quality
Romain Gandon
CEO, Quantlake
Disclaimer: This article is for informational and educational purposes only and does not constitute investment advice. Past performance is not indicative of future results.


