.png)
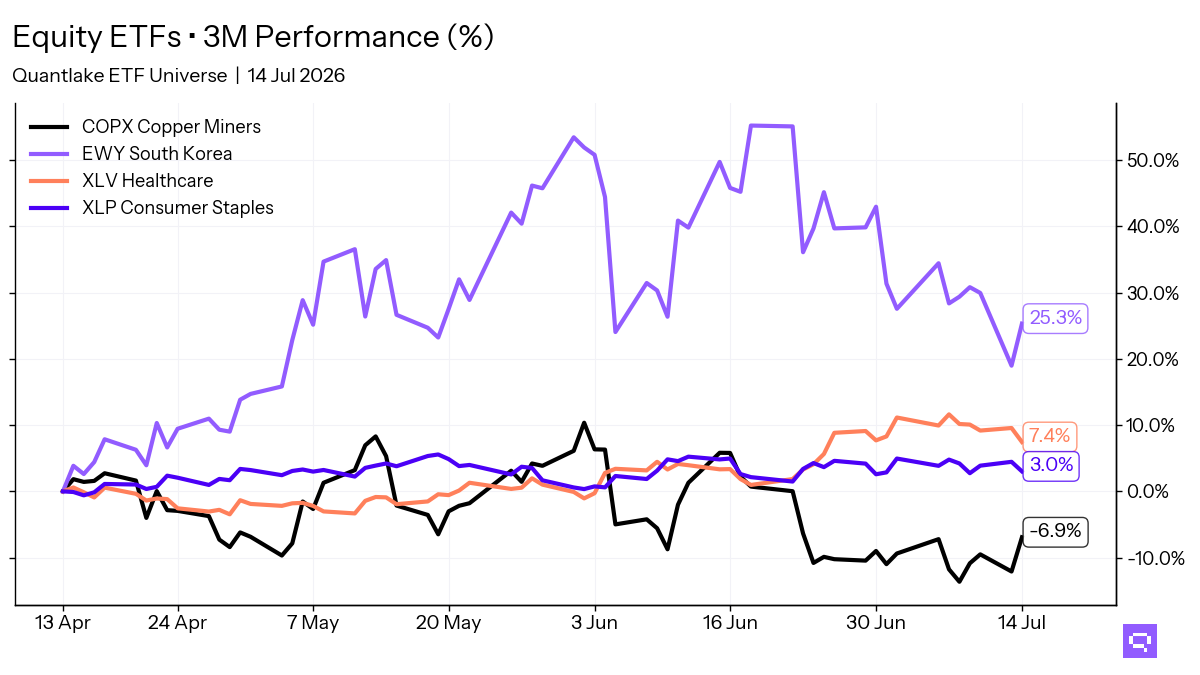
Dividend & EFA Lead as Equity Momentum Turns Defensive
Equity momentum across the ETFs we track remains led by dividends and international developed markets, while large-cap growth continues to lag. Relative to last week’s broadening impulse, the tape shifted to a more uniformly defensive velocity profile, with deceleration spreading across the full universe even as the leadership stack held.
The regime still reads as rotation rather than a single beta tape. Several leaders show clear decoupling in correlation to SPY versus their 1-year mean alongside large positive alpha contribution. iShares Select Dividend ETF (DVY) shows correlation to SPY of -0.07 versus 0.69, and iShares MSCI EFA ETF (EFA) sits at 0.23 versus 0.76.
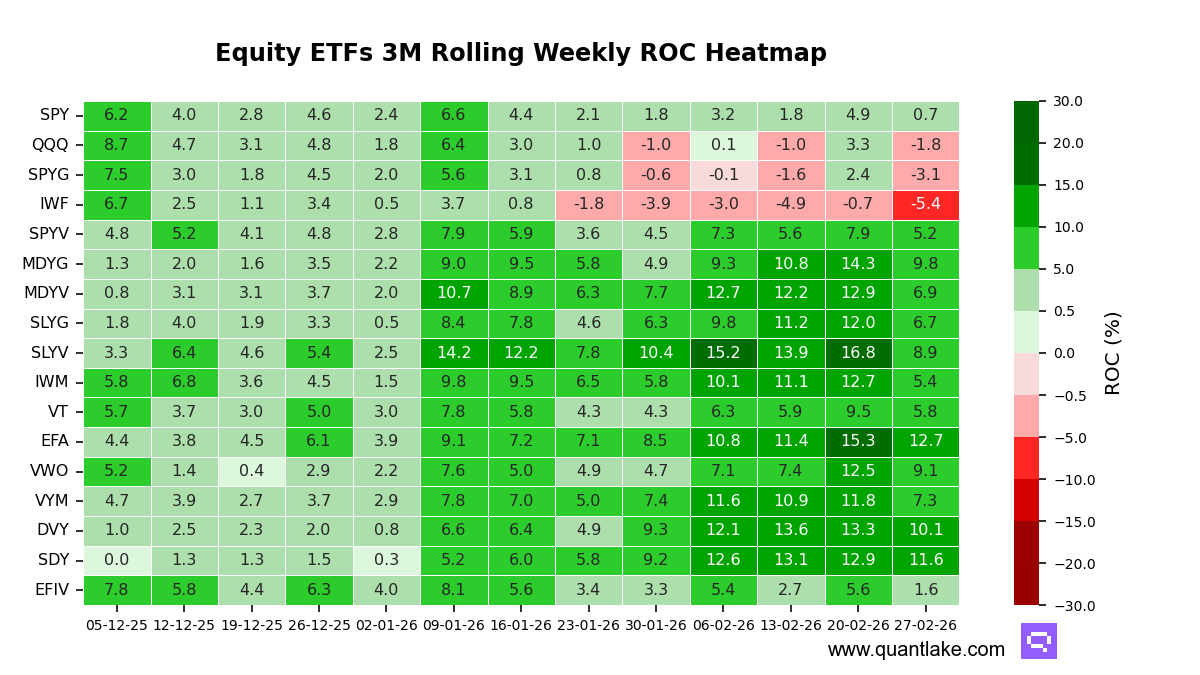
Over the week, breadth deteriorated: all 17 ETFs we track saw weaker 3-month trailing momentum versus last week. The smallest declines came from SPDR S&P Dividend ETF (SDY) at -1.3 points, iShares MSCI EFA ETF (EFA) at -2.6 points, and SPDR Portfolio S&P 500 Value ETF (SPYV) at -2.7 points. The largest declines were led by SPDR Portfolio S&P 600 Small Cap Value ETF (SLYV) at -7.9 points, iShares Russell 2000 ETF (IWM) at -7.3 points, and SPDR Portfolio S&P 400 Mid Cap Value ETF (MDYV) at -6.0 points. Invesco QQQ (QQQ) and SPDR Portfolio S&P 500 Growth ETF (SPYG) flipped negative.
In level terms, EFA and SDY sit in the top decile, with DVY in the upper third. Vanguard FTSE Emerging Markets ETF (VWO) and SPDR Portfolio S&P 400 Mid Cap Growth ETF (MDYG) also sit in the upper third, while QQQ and SPYG remain in the lower half and iShares Russell 1000 Growth ETF (IWF) sits in the bottom decile.
Stretch looks less acute than last week. SDY is elevated and close to statistically stretched with a Z-score of 1.95, and it sits near its 12-month peak, keeping normalization risk on the radar. EFA and DVY are elevated but not extreme at 1.49 and 1.23, respectively, with no broad cluster showing statistically depressed readings.
Attribution continues to separate idiosyncratic leaders from beta proxies. EFA, SDY, and DVY pair low correlation to SPY with large alpha contribution of 12.5 points, 11.5 points, and 10.1 points, consistent with improving diversification. By contrast, Vanguard Total World Stock ETF (VT) and iShares MSCI EFA Value ETF (EFIV) show correlation to SPY of 0.91 and 0.95, with more modest alpha contribution of 5.2 points and 0.9 points, behaving more like beta proxies.
Our take: Last week’s view of a rotation with widening participation is challenged by this week’s unanimous momentum deceleration, even as dividend and international leadership remains the cleanest idiosyncratic pocket.
![Equity ETFs 3M Rolling Weekly Correlation Heatmap [vs SPY]](https://cdn.prod.website-files.com/654bb12ba4f14cf6cef8fb8a/69a441692066c4c753c2c70a_HeatMap_BROAD_INDICES_Tactical_01032026_corr.png)
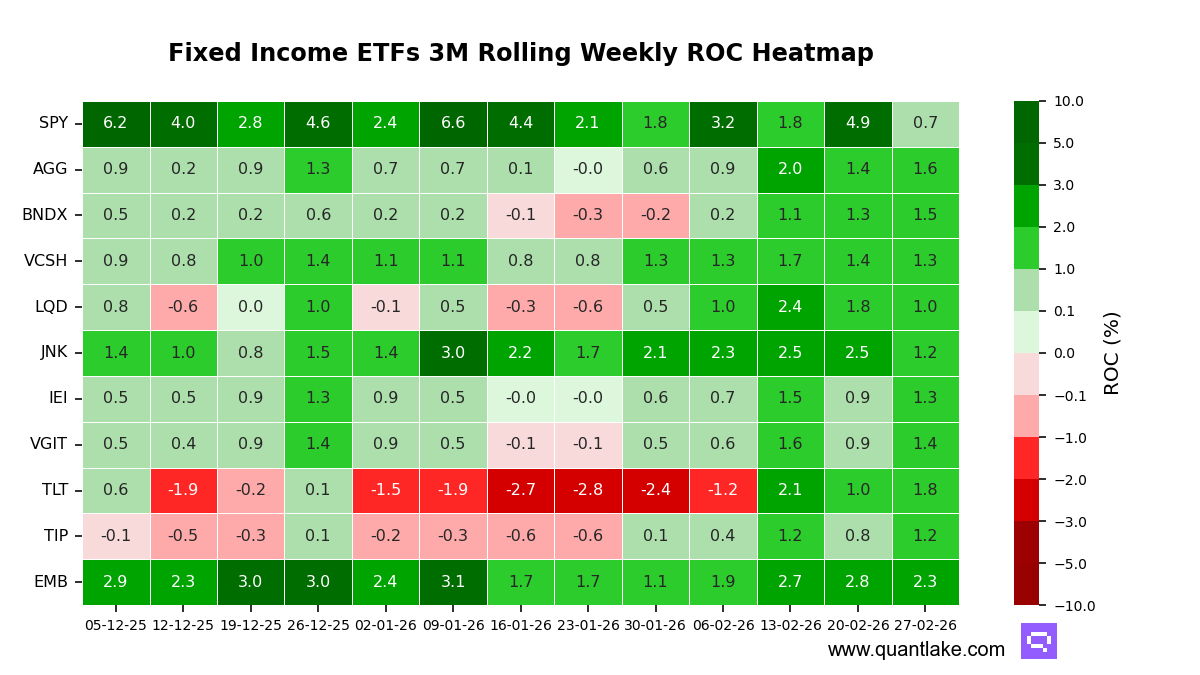
Credit no longer held a clean lead over duration in our fixed income tape, with Treasuries rotating back to the front and spread product slipping into the laggard lane. Versus last week’s setup, the curve picture re-steepened in momentum terms as the long end moved from clear drag to clear support, leaving leadership more mixed across credit and rates.
Linkage to the broad equity benchmark continued to separate the sleeves. High yield remained the most risk-on expression in our universe, with correlation at 0.60, while most Treasury and core bond exposures sat in low to negative territory, preserving hedging characteristics. Alpha contribution also skewed toward rates and core: iShares 20+ Year Treasury Bond (TLT) showed +1.9 points of alpha contribution, and iShares Core US Aggregate Bond (AGG) showed +1.7 points, while SPDR Bloomberg High Yield Bond (JNK) printed a smaller +0.8 points.
This week’s breadth improved versus last week: six of the ETFs we track strengthened on a three-month trailing basis and five weakened. The strongest accelerations were TLT at +0.8 points, Vanguard Intermediate-Term Treasury (VGIT) at +0.5 points, and iShares 3–7 Year Treasury Bond (IEI) at +0.4 points. The sharpest decelerations were JNK at -1.3 points, iShares iBoxx $ Investment Grade Corporate Bond (LQD) at -0.8 points, and iShares J.P. Morgan USD Emerging Markets Bond (EMB) at -0.5 points.
Leadership in level terms now sits with EMB at the top of the stack, with TLT and AGG close behind in the upper tier. BNDX and VGIT sit mid-pack, while LQD is in the bottom decile, with JNK and TIP in the lower half.
Statistical stretch remains muted. No ETF is near a statistical ceiling or floor, with the widest Z-score only 0.87 for BNDX, consistent with modest overshooting rather than an extreme. Most constituents also sit meaningfully below their 12-month momentum peaks, including TLT at 6.4 points off its high and JNK at 5.4 points off its high, framing the current tape as normalization-prone rather than exhaustion at an extreme.
From an attribution lens, the week’s leadership looks more internally driven than beta-led. TLT combined negative correlation to the broad equity benchmark (-0.17 versus a -0.10 one-year mean) with positive alpha, signaling improved diversification alongside momentum acceleration. JNK, by contrast, kept elevated positive correlation (0.60 versus a 0.74 mean), which supports upside participation when equities advance but reduces hedging effectiveness in drawdowns, and its smaller alpha contribution argues for more beta-like behavior than idiosyncratic leadership.
Our take: The evidence reinforces last week’s message of a dispersed tape, but the leadership baton rotated back toward duration as Treasuries led the week’s momentum acceleration while credit cooled.
![Fixed Income ETFs 3M Rolling Weekly Correlation Heatmap [vs SPY]](https://cdn.prod.website-files.com/654bb12ba4f14cf6cef8fb8a/69a4418f4300489a88d760f7_HeatMap_FIXED_INCOME_Tactical_01032026_corr.png)