.png)

Sector Rotation: Tech Leads as Dispersion Normalizes
Dispersion sits in a normal regime near its 60-day average. Technology Select Sector SPDR® Fund leads; Materials Select Sector SPDR® Fund gains ground.
US equity sector dispersion across the 11 S&P 500 sector ETFs sits in a normal regime, with a z-score of 0.35 near its 60-day average. Positive dispersion velocity marks a standard rotation backdrop, leaving selection breadth available but not broad-based.
Technology Select Sector SPDR® Fund leads the cross-section and is the confirmed leader. Its 5-day relative strength is firmly positive, its 20-day relative strength ranks 1st, and recent velocity is accelerating. Consumer Discretionary Select Sector SPDR® Fund and Health Care Select Sector SPDR® Fund also sit in the leading quadrant, but both register as secondary leaders against Technology’s stronger short-horizon impulse.
Materials Select Sector SPDR® Fund turns higher from a lagging base and marks the clearest early rotation, with 5-day relative strength inflecting above zero against slightly negative 20-day relative strength. Industrial Select Sector SPDR® Fund shows a similar but smaller improving profile. Defensive and commodity-linked sectors cluster below average on both horizons, forming the lagging pocket.
We favor concentrated exposure to Technology leadership while selectively adding early rotation candidates rather than broad sector beta.
Sector Rotation Map
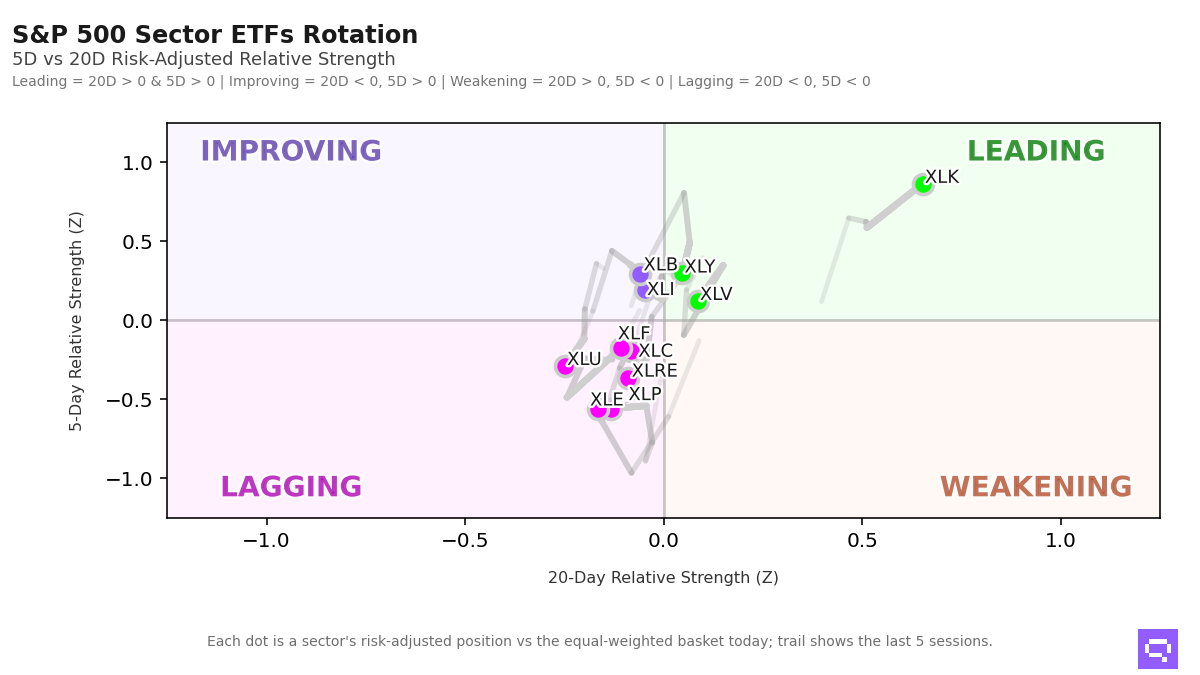
Alpha Z: risk-adjusted relative strength vs the equal-weighted S&P 500 sector basket (Z-score). Velocity: rate of change in short-term relative strength (1D vs 5D Z-score delta — tactical momentum). Structural velocity: smoothed 5D vs 20D momentum delta, reflecting regime-level directional shifts.
Momentum Leaders
• Technology — Rank #1 | Alpha Z: +1.82 | Velocity: +0.95
• Health Care — Rank #9 | Alpha Z: -0.56 | Velocity: -0.68
• Consumer Discretionary — Rank #7 | Alpha Z: -0.50 | Velocity: -0.80
Rotation Warnings
• Communication Services — Rank shift (1D vs 5D): -1 | Structural velocity: -0.11
• Real Estate — Rank shift (1D vs 5D): -1 | Structural velocity: -0.28
Mean Reversion Candidates
• Financial — Alpha Z: +1.51 | Velocity: +1.68
• Energy — Alpha Z: -0.40 | Velocity: +0.16
• Utilities — Alpha Z: -0.01 | Velocity: +0.28
Romain Gandon
CEO, Quantlake
Disclaimer: This article is for informational and educational purposes only and does not constitute investment advice. Past performance is not indicative of future results.