.png)

Tactical Trends: Dividend and Low-Vol Equity Lead as Growth and Ex-US Fade
Price breadth fell 28.8pp as leadership shifted to dividends and low vol
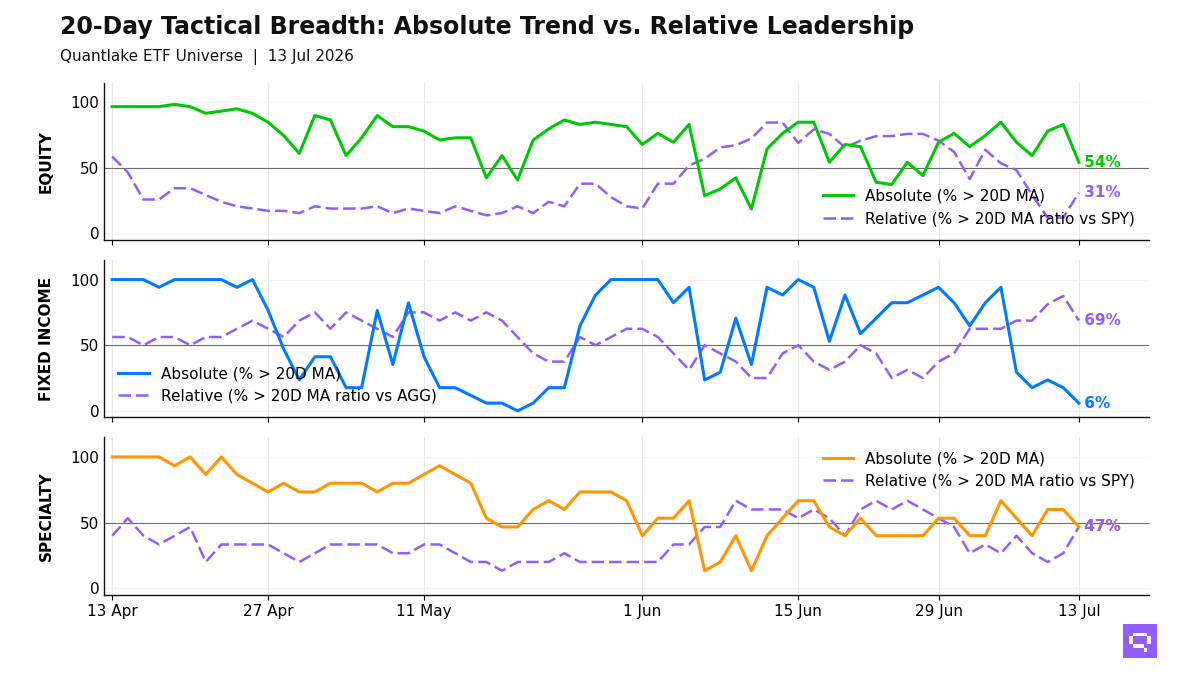
Defensive leadership defines our ETF universe on July 13, with 32 of 59 ETFs (54%, -28.8pp on the day) above their 20-day moving average (20D MA) and 18 of 58 ETFs (31%, +19.0pp) above their 20-day ratio moving average versus the S&P 500 SPY (20D ratio MA vs SPY). Low-volatility, dividend, quality, and equal-weight exposures lead on a relative basis, while growth, developed ex-US, and Asia form the laggard cluster. A 23pp price-relative gap leaves price participation ahead of leadership, so the equity read centers on defensive rotation inside a narrower price field.
Fixed income shows little absolute participation, with 1 of 17 ETFs (6%) above the 20D MA and leadership limited to short-duration inflation-linked exposure. Against the Aggregate Bonds AGG, 11 of 16 ETFs (69%) beat the benchmark, with short duration, Treasuries, and high yield leading while Corporate Credit VCIT and Long Treasury TLT lag. The bond split favors stability and selected duration over investment-grade rate sensitivity.
Specialty leadership centers on alternatives and real estate, with 7 of 15 ETFs above both their 20D MA and 20D ratio MA versus the S&P 500 SPY. Managed Futures DBMF leads, while Bitcoin Trust IBIT and gold-linked names lag. Oil and broad commodities outperform the S&P 500 SPY, while silver lags. The non-core bucket concentrates strength in alternatives, real estate, and energy-linked exposure.
20-Day Tactical Breadth
Key Takeaways
Equity cross-timescale alignment is 53%, with Dividend Quality SCHD, Quality Factor QUAL, and High Dividend VYM in the daily, weekly, and monthly relative leader cluster. Dev. Markets EFA and Russell Growth IWF anchor the multi-horizon laggards. The multi-horizon read concentrates leadership in defensive income and quality.
Fixed income cross-timescale alignment is 65%. The key split runs between relative winners that are below their 20D MA and above the 20D ratio MA vs AGG, such as High Yield HYG and High Yield Bonds JNK, and relative losers such as Mortgage-Backed MBB and Corporate Credit VCIT. The bond cross-section rewards shorter duration and selected spread exposure on a relative basis, with long duration and investment-grade credit on the weak side.
Oil USO, down 8.57% over the trailing 20-day window, crossed above its 20-day moving average. Its ratio vs the S&P 500 SPY also crossed above the 20D ratio MA vs SPY, and Broad Commodities PDBC joined that relative move. Commodity strength clusters in energy and diversified exposure, while silver lags.
FEATURED ETF: United States Oil Fund LP USO

Other Technical Signal Events
Equity: Price vs 20-day MA
| Signal | Ticker | Name | 20D perf |
|---|---|---|---|
| Cross-up | IDV | iShares International Select Dividend ETF | -2.77% |
| Cross-down | XLI | Industrial Select Sector | +3.23% |
| Cross-down | SLYG | SPDR S&P 600 Small Cap Growth ETF | +3.10% |
| Cross-down | INDA | iShares MSCI India ETF | +2.09% |
| Cross-down | EWJ | iShares MSCI Japan ETF | +1.13% |
| Cross-down | VB | Vanguard Small-Cap Index ETF | +0.93% |
| Cross-down | IYW | iShares U.S. Technology ETF | +0.61% |
| Cross-down | VT | Vanguard Total World Stock Index ETF | +0.49% |
| Cross-down | IVLU | iShares Edge MSCI Intl Value Factor ETF | +0.18% |
| Cross-down | EFA | iShares MSCI EAFE ETF | +0.14% |
| Cross-down | IWF | iShares Russell 1000 Growth ETF | +0.10% |
| Cross-down | XLY | Consumer Discretionary Select Sector | unch. |
| Cross-down | IQLT | iShares MSCI Intl Quality Factor ETF | unch. |
| Cross-down | VWO | Vanguard FTSE Emerging Markets Index ETF | -0.41% |
| Cross-down | VGK | Vanguard FTSE Europe Index ETF | -0.45% |
| Cross-down | EWG | iShares MSCI Germany ETF | -0.50% |
| Cross-down | EWT | iShares MSCI Taiwan ETF | -0.56% |
| Cross-down | QQQ | Invesco QQQ | -0.64% |
| Cross-down | XLK | Technology Select Sector | -0.94% |
Equity vs SPY: Price Ratio vs 20-day MA
| Signal | Ticker | Name | 20D rel perf |
|---|---|---|---|
| Cross-up | FXI | iShares China Large-Cap ETF | -5.21% |
| Cross-up | XLE | Energy Select Sector | -1.73% |
| Cross-up | EFAV | iShares MSCI EAFE Min Vol Factor ETF | -1.32% |
| Cross-up | SCHD | Schwab U.S. Dividend Equity ETF | -0.90% |
| Cross-up | ACWV | iShares MSCI Global Min Vol Factor ETF | -0.54% |
| Cross-up | QUAL | iShares MSCI USA Quality Factor ETF | -0.35% |
| Cross-up | VYM | Vanguard High Dividend Yield Index ETF | unch. |
| Cross-up | SPYV | S&P 500 Value ETF | +0.26% |
| Cross-up | VIG | Vanguard Dividend Appreciation Index ETF | +0.33% |
| Cross-up | JEPI | JPMorgan Equity Premium Income ETF | +0.60% |
| Cross-up | RSP | Invesco S&P 500 Equal Weight ETF | +0.71% |
| Cross-up | SDY | SPDR S&P Dividend ETF | +0.93% |
| Cross-up | XLU | Utilities Select Sector | +2.60% |
| Cross-down | SPYG | S&P 500 Growth ETF | -0.23% |
| Cross-down | IWF | iShares Russell 1000 Growth ETF | -1.67% |
Fixed Income: Price vs 20-day MA
| Signal | Ticker | Name | 20D perf |
|---|---|---|---|
| Cross-down | JNK | SPDR Bloomberg High Yield Bond ETF | unch. |
| Cross-down | HYG | iShares iBoxx $ High Yield Corporate Bond ETF | unch. |
Fixed Income vs AGG: Price Ratio vs 20-day MA
| Signal | Ticker | Name | 20D rel perf |
|---|---|---|---|
| Cross-down | VCIT | Vanguard Intermediate-Term Corporate Bond Index ETF | unch. |
| Cross-down | MBB | iShares MBS ETF | -0.13% |
| Cross-down | PFF | iShares Preferred and Income Securities ETF | -0.86% |
Specialty: Price vs 20-day MA
| Signal | Ticker | Name | 20D perf |
|---|---|---|---|
| Cross-down | JEPQ | JPMorgan Nasdaq Equity Premium Income ETF | +1.22% |
| Cross-down | IBIT | iShares Bitcoin | -2.30% |
Specialty vs SPY: Price Ratio vs 20-day MA
| Signal | Ticker | Name | 20D rel perf |
|---|---|---|---|
| Cross-up | VNQ | Vanguard Real Estate Index ETF | -0.69% |
| Cross-up | DBMF | iMGP DBi Managed Futures Strategy ETF | -0.47% |
| Cross-up | REET | iShares Global REIT ETF | -0.33% |
| Cross-up | FTLS | First Trust Long/Short Equity ETF | -0.28% |
| Cross-down | IBIT | iShares Bitcoin | -4.04% |
Commodities: Price vs 20-day MA
| Signal | Ticker | Name | 20D perf |
|---|---|---|---|
| Cross-up | USO | United States Oil Fund LP | -8.57% |
Commodities vs SPY: Price Ratio vs 20-day MA
| Signal | Ticker | Name | 20D rel perf |
|---|---|---|---|
| Cross-up | USO | United States Oil Fund LP | -10.19% |
| Cross-up | PDBC | Invesco Optimum Yield Diversified Commodity Strategy No K-1 ETF | -3.71% |
Romain Gandon
CEO, Quantlake
Disclaimer: This article is for informational and educational purposes only and does not constitute investment advice. Past performance is not indicative of future results.