.png)

Intermediate Trends: Equity Leadership Narrows Into Growth and Asia
Price breadth held high as relative leadership stayed narrow
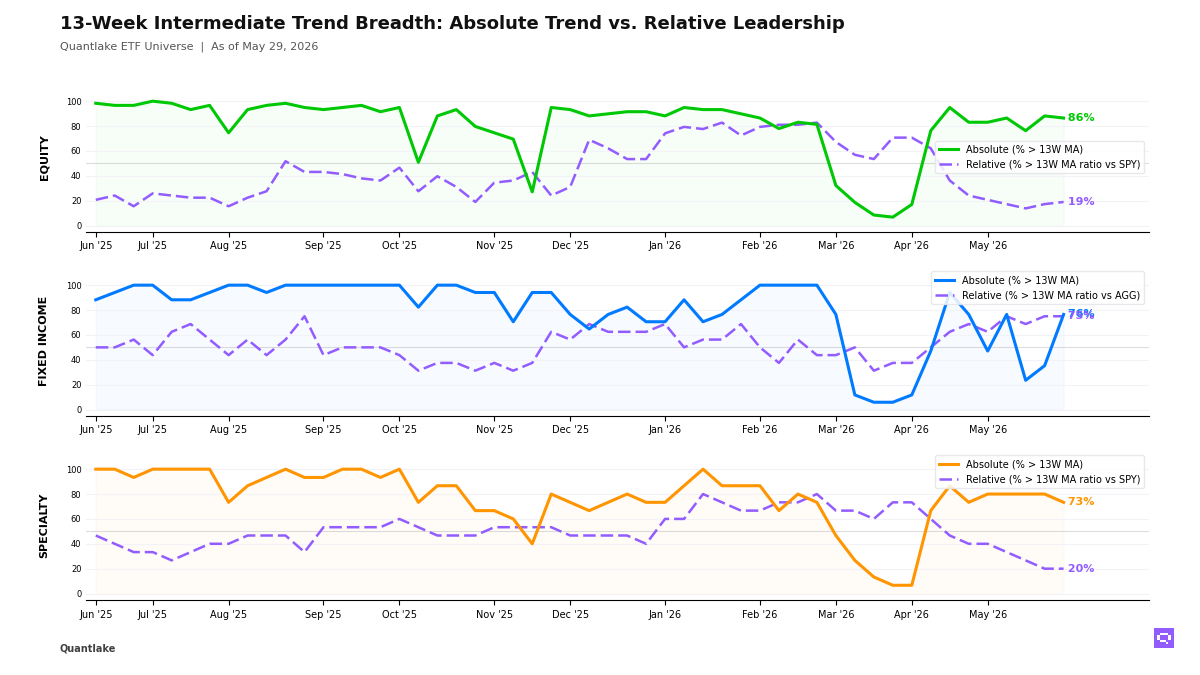
The week closed with a benchmark-led equity tape across our ETF universe. We count 51 of 59 ETFs (86%, -1.7pp) above their 13-week moving average, but only 11 of 58 ETFs (19%, +1.7pp) outperformed the S&P 500 SPY, leaving a +67pp gap. US growth, technology, Taiwan, South Korea, emerging markets and copper-linked equities carried the upside, whereas developed ex-US, low-volatility, dividend-oriented US equity, China and Brazil failed to confirm, which leaves equity leadership narrow by construction.
Fixed income broadened decisively. We count 13 of 17 ETFs (76%, +41.2pp) above their 13-week moving average, and 12 of 16 ETFs (75%, unchanged on the week) outperformed the Aggregate Bonds AGG. Credit, EM debt, mortgages, munis, inflation-linked bonds and short-duration exposures drove the expansion, while Treasuries and long duration stayed behind the benchmark, which keeps the recovery centered on spread product and front-end stability.
Confirmation weakened in specialty and commodities. In specialty, we count 11 of 15 ETFs (73%, -6.7pp) above their 13-week moving average, yet only 3 of 15 ETFs (20%, unchanged on the week) beat the S&P 500 SPY, with semiconductors, momentum and clean energy carrying the relative upside as bitcoin proxies, gold and gold miners slipped below their 13-week moving averages. Oil, agriculture and copper all weakened in commodities, which leaves our alternative sleeve selective and losing hard-asset confirmation.
13-Week Intermediate Breadth
Key Takeaways
• Equity posted 81% cross-timescale alignment. Copper Miners COPX crossed above its ratio moving average versus the S&P 500 SPY even though its 13-week relative return remained at -16.71%. The crossover marks stabilization from a weak base and fits the concentrated leadership profile already visible in Asia and US growth exposures.
• Investment Grade Credit LQD, Corporate Credit VCIT, Short Corporate VCSH, Mortgage-Backed MBB, Muni Bonds MUB, and TIPS TIP all crossed above their 13-week moving averages. Relative leadership in fixed income still sat with credit, EM debt, mortgages, munis, and short duration over the Aggregate Bonds AGG, while Treasury exposures stayed on the lagging side. The duration split stayed explicit across our bond coverage.
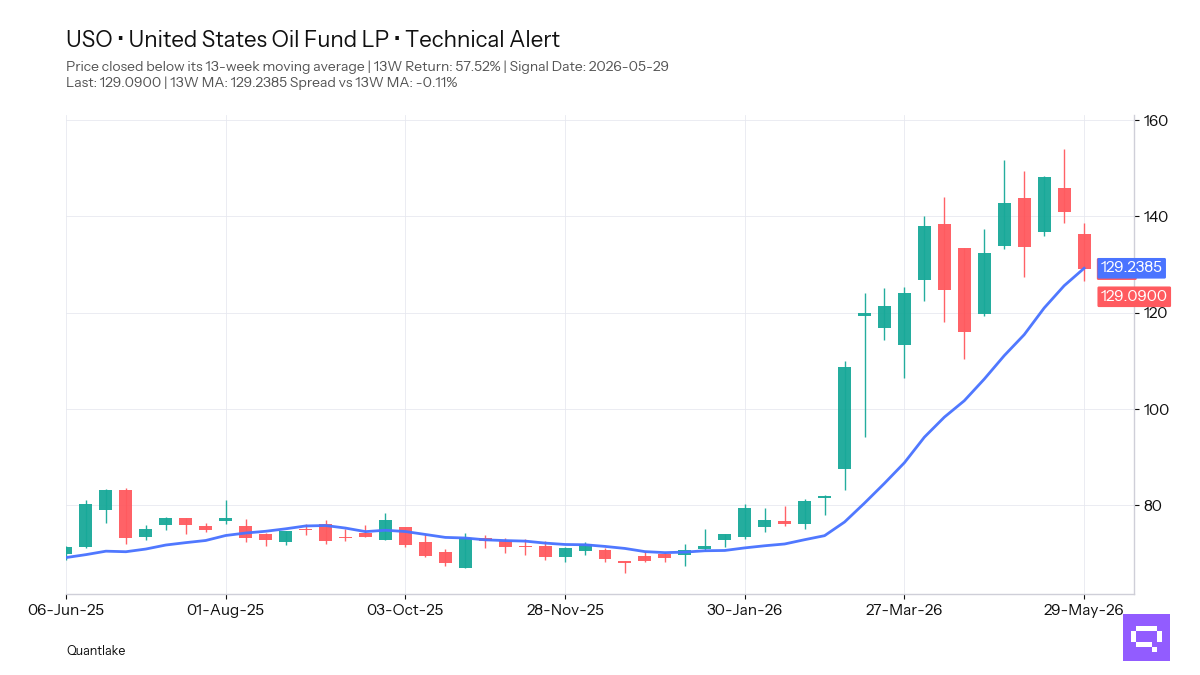
• Oil USO, with a +57.52% period return, crossed below its 13-week moving average. Its ratio versus the S&P 500 SPY also crossed below its ratio moving average after a +42.46% 13-week relative return. Bitcoin Trust IBIT also crossed below its 13-week moving average after a +11.94% 13-week return. Commodity and crypto confirmation stayed thinner than the strength still visible in selected equity-linked niches.
FEATURED ETF — United States Oil Fund LP USO
Other Technical Signal Events
EQUITY
↗ Price breakouts (cross-up 13W MA)
• INDA - iShares MSCI India ETF · 13W perf: -7.1%
• XLB - Materials Select Sector · -3.8%
↘ Price breakdowns (cross-down 13W MA)
• XLE - Energy Select Sector · 13W perf: +1.3%
• EFAV - iShares MSCI EAFE Min Vol Factor ETF · -4.1%
• XLP - Consumer Staples Select Sector · -7.4%
↗ Leadership gains (cross-up 13W MA vs SPY)
• COPX - Global X Copper Miners ETF · 13W relative perf: -16.7%
↘ Leadership losses (cross-down 13W MA vs SPY)
None for the week
FIXED INCOME
↗ Price breakouts (cross-up 13W MA)
• MBB - iShares MBS ETF · 13W perf: -1.2%
• VCIT - Vanguard Intermediate-Term Corporate Bond · -1.1%
• LQD - iShares iBoxx $ Investment Grade Corporate Bond ETF · -0.9%
• MUB - iShares National Muni Bond ETF · -0.8%
• VCSH - Vanguard Short-Term Corporate Bond · -0.2%
• TIP - iShares TIPS Bond ETF · unch.
↘ Price breakdowns (cross-down 13W MA)
None for the week
↗ Leadership gains (cross-up 13W MA vs AGG)
None for the week
↘ Leadership losses (cross-down 13W MA vs AGG)
None for the week
SPECIALTY
↗ Price breakouts (cross-up 13W MA)
None for the week
↘ Price breakdowns (cross-down 13W MA)
• IBIT - iShares Bitcoin · 13W perf: +11.9%
↗ Leadership gains (cross-up 13W MA vs SPY)
None for the week
↘ Leadership losses (cross-down 13W MA vs SPY)
None for the week
COMMODITIES
↗ Price breakouts (cross-up 13W MA)
None for the week
↘ Price breakdowns (cross-down 13W MA)
• USO - United States Oil Fund LP · 13W perf: +57.5%
• DBA - Invesco DB Agriculture · +4.7%
↗ Leadership gains (cross-up 13W MA vs SPY)
None for the week
↘ Leadership losses (cross-down 13W MA vs SPY)
• USO - United States Oil Fund LP · 13W relative perf: +42.5%
• CPER - United States Copper LP · -4.7%
Romain Gandon
CEO, Quantlake
Disclaimer: This article is for informational and educational purposes only and does not constitute investment advice. Past performance is not indicative of future results.