.png)
Daily SPY Candlestick: Matching Low
Matching Low in Greed: Median Return Compresses to +1.6% vs +2.2% Globally
Wednesday’s Matching Low followed a flat SPY session at -0.0% and signals support confirmation, with multiple candles posting similar lows that mark a defended price area.
Since 2009, the pattern has appeared 23 times. The one-month profile resolved higher 78.3% of the time, with a +2.2% median return, a +2.9% average return, and a +2.39 Sharpe. The distribution centered on positive outcomes. The middle 50% ran from +0.3% to +4.7%. The tail spread ran from -1.7% at the 10th percentile to +8.2% at the 90th, and the full range stretched from -3.2% to +13.0%. Upside outcomes outweighed downside outcomes in both frequency and magnitude.
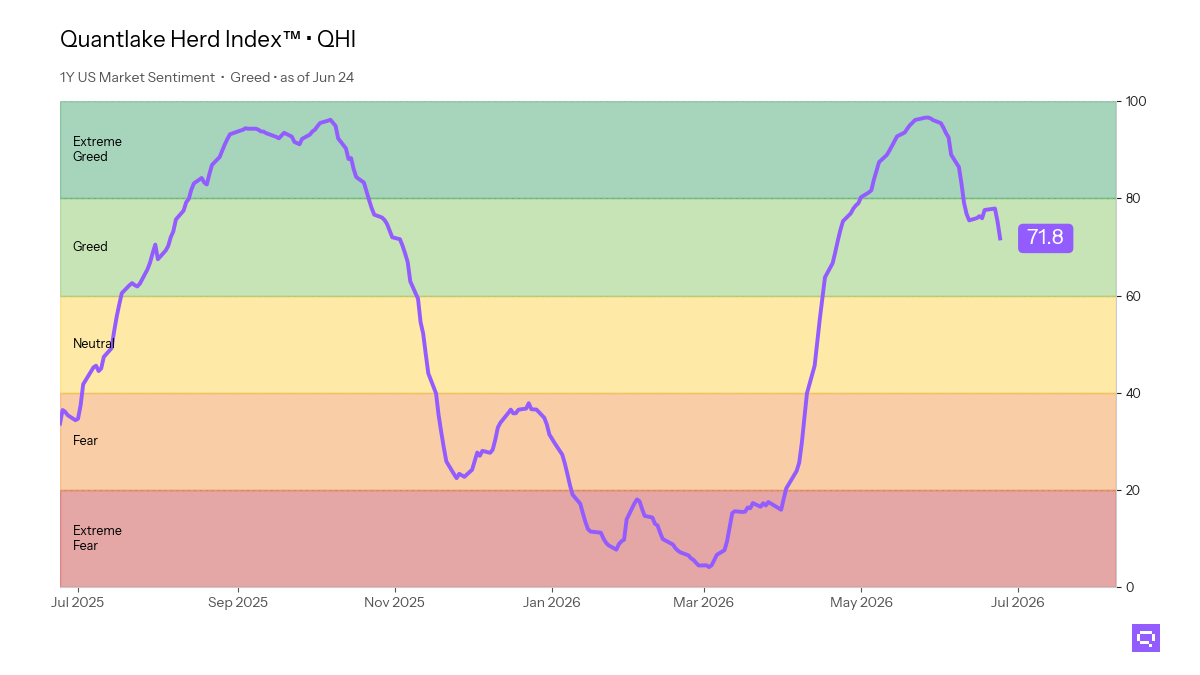
In Quantlake Herd Index (QHI) Greed, a regime that reflects elevated crowd participation, the one-month profile improved on direction and risk-adjusted return. The up rate rose to 100.0%, and the Sharpe climbed to +4.43 across 3 observations. Central tendency stayed positive at a +1.6% median and +2.3% average. The regime range compressed to +1.3% to +3.0% across the middle 50% and to +1.1% to +3.8% across the 10th to 90th percentile band. The regime sample showed narrower positive outcomes rather than larger upside extremes. With only 3 observations in this regime, treat all regime statistics as indicative only.
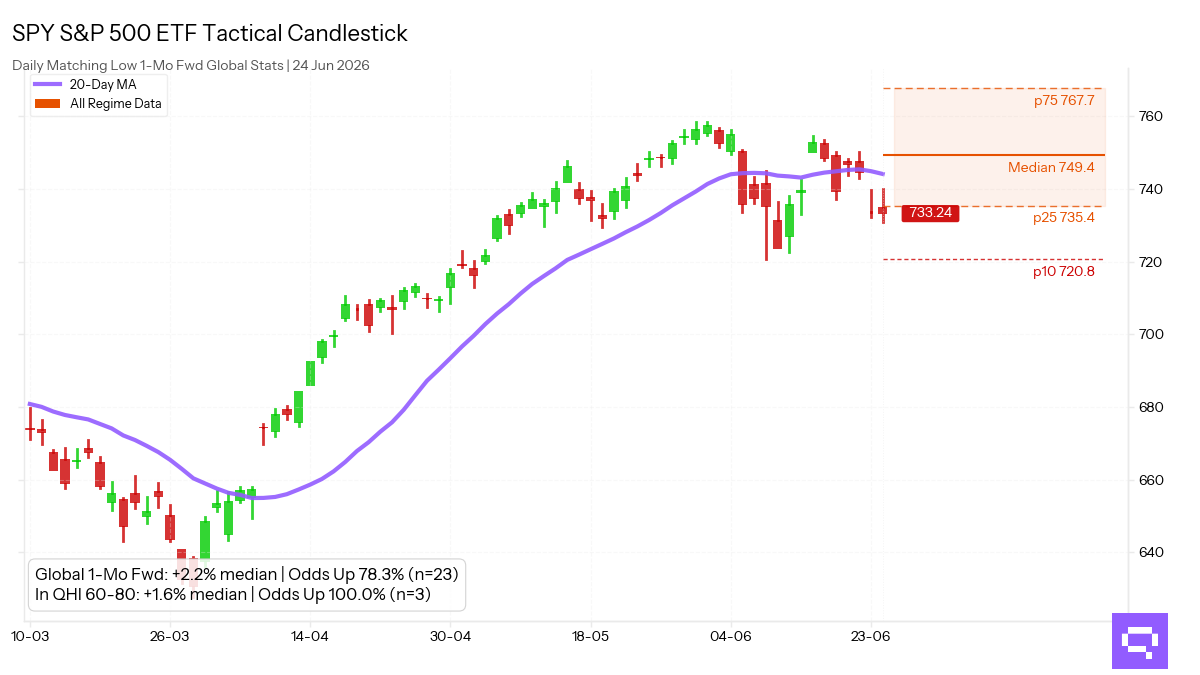
Warning: low sample (n<30), statistical significance is reduced.
Warning: low sample (n<30), statistical significance is reduced.
The full QHI historical series since September 1, 2009 is available via the Quantlake API for systematic integration. Learn more about the QHI methodology →
Data: 24 Jun 2026 · Daily Time Scale.
Romain Gandon
CEO, Quantlake
Disclaimer: This article is for informational and educational purposes only and does not constitute investment advice. Past performance is not indicative of future results.
Definitions
Quantlake Herd Index (QHI)
The Quantlake Herd Index (QHI) is a proprietary cross-asset behavioral sentiment composite ranging from 0 to 100 that measures extremes in investor psychology across the U.S. financial system.
It aggregates signals from U.S. equity momentum and breadth, equity market concentration dynamics, credit market risk appetite (high-yield vs investment-grade demand), implied volatility conditions, and credit spread behavior. These inputs are normalized into a single behavioral risk barometer reflecting the balance between risk-averse and risk-on investor behavior.
Because markets are influenced by behavioral biases, sentiment extremes frequently precede mean reversion in forward returns.
QHI Regimes
0–20: Extreme Fear
20–40: Fear
40–60: Neutral
60–80: Greed
80–100: Extreme Greed
Statistical Terms
Median
The midpoint of the return distribution — 50% of outcomes fell above and 50% below this value. Less sensitive to extreme outliers than the average.
p25 / p75 (Interquartile Range)
The range within which the middle 50% of historical outcomes fell. p25 marks the 25th percentile (bottom of the range); p75 marks the 75th percentile (top). A tighter range indicates a more predictable pattern; a wide range reflects high dispersion.
p10 / p90 (Tail Interval)
The range encompassing the middle 80% of historical outcomes. P10 represents the 10th percentile (the "downside" threshold), while P90 represents the 90th percentile (the "upside" threshold). Unlike the Interquartile Range, this metric captures the shoulders of the distribution, providing a clearer view of potential tail risk and extreme performance potential.
Skew (γ1 — Skewness)
Measures the asymmetry of the return distribution. A negative skew (γ1 < 0) signals a left-tailed distribution — most outcomes cluster on the positive side, but the rare negative outcomes can be severely large. A positive skew (γ1 > 0) is the opposite.
Kurt (γ2 — Excess Kurtosis)
Measures tail density relative to a normal distribution. A high positive value (Leptokurtic) indicates fat tails — extreme events occur more frequently than a normal distribution would predict. A negative value (Platykurtic) indicates thinner tails.
Mesokurtic
A kurtosis value typically within a range of -0.5 to +0.5, consistent with a normal (Gaussian) distribution. Tail risk is neither elevated nor suppressed relative to standard statistical models.
Gaussian (Normal Distribution)
The classic bell-curve distribution. When a pattern's moments are described as "consistent with Gaussian expectations," it means tail risk behaves as standard statistical models would predict — no unusual concentration of extreme outcomes.
Sharpe Ratio (annualised)
Measures risk-adjusted return — the average 1-month forward return divided by its standard deviation, scaled to an annual rate (×√12). A ratio above 1.0 indicates strong return per unit of risk; below 0.5 is weak; negative means the average outcome was a loss. It does not capture skewness or tail risk, so it should be read alongside the distribution metrics above.