.png)

Sector Rotation: Materials Lead the Weekly Rebound
Energy XLE led the week's sharpest rotation lower and Materials XLB tops current standings.
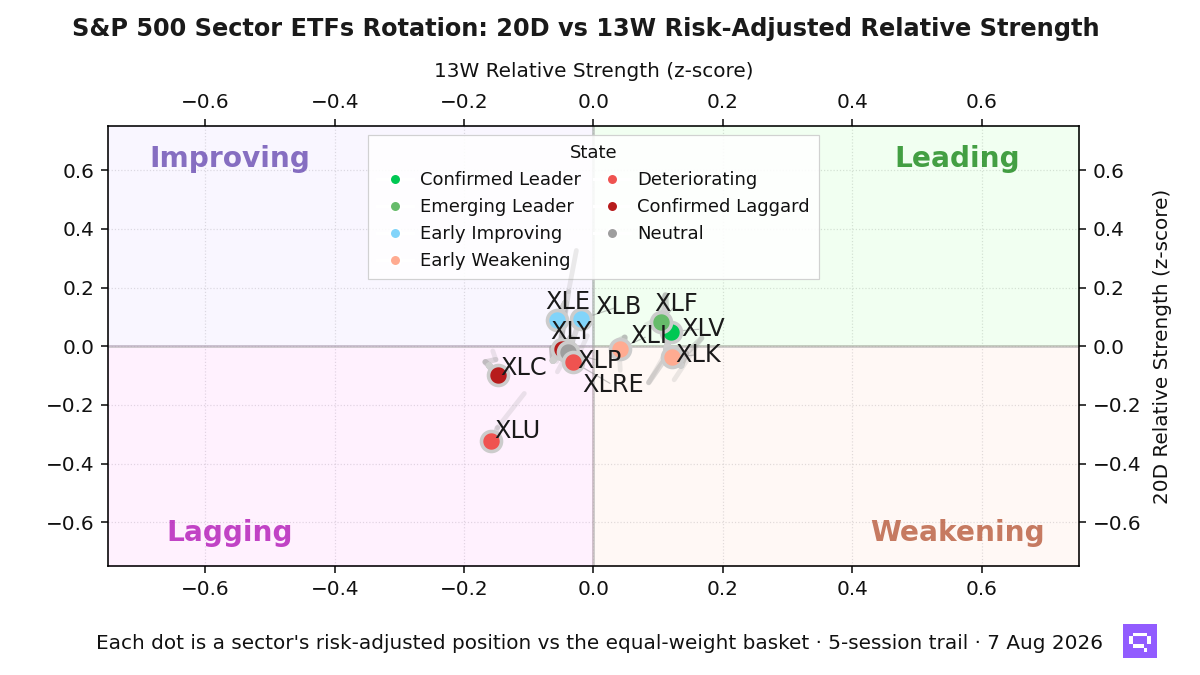
Sector dispersion across the eleven S&P 500 sector ETFs is in a normal regime as of August 7. The z-score against its GARCH-normalised mean is -0.82, and the spread narrowed markedly over the past five sessions. The regime leaves selection payoffs below average, so this week hinges more on sector rotation inside a compressed cross-section than on a wide beta split.
Materials XLB posted the strongest upside rotation in the field and tops the week at +0.49. Its 20-day (tactical) line turned positive, and the 13-week (intermediate) line sits near zero, so the move reads as a tactical recovery rising into leadership. Industrial XLI and Technology XLK also rotated higher into second and third, yet both sit in early-weakening states; Consumer Discretionary XLY rose to fourth from a lagging base, and Communication Services XLC ranks fifth even as its rotation bent toward Weakening. Health Care XLV advanced from a confirmed-leader base but ranks sixth this week, so the weekly lead has thinner 13-week backing than the standings imply.
Energy XLE drove the week's sharpest rotation lower and fell to tenth, a recovery candidate that rolled over on both lines from a mild negative 13-week base. Utilities XLU deteriorated to last at -0.80, and Real Estate XLRE joined it in the lagging cluster; Consumer Staples XLP was nearly stationary and ranks eighth. Financial XLF slipped to seventh with a mild positive 13-week line, and six of the eleven sectors post positive current-week readings. The weekly split is broader on the 5-day line than on the 13-week line, so tactical participation outruns intermediate backing.
Sector Rotation Map
Romain Gandon
CEO, Quantlake
Disclaimer: This article is for informational and educational purposes only and does not constitute investment advice. Past performance is not indicative of future results.