.png)

Tactical Trends: Emerging Markets and Growth Reclaim the 20-Day Line
Price participation rebounds faster than benchmark-relative leadership
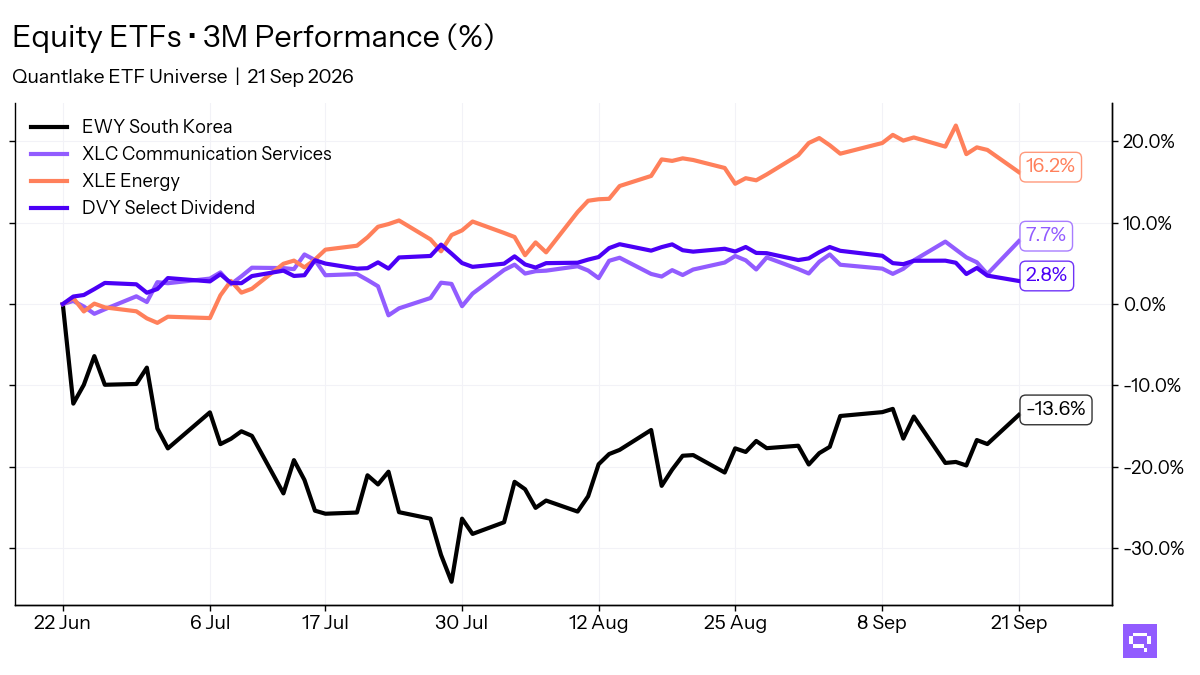
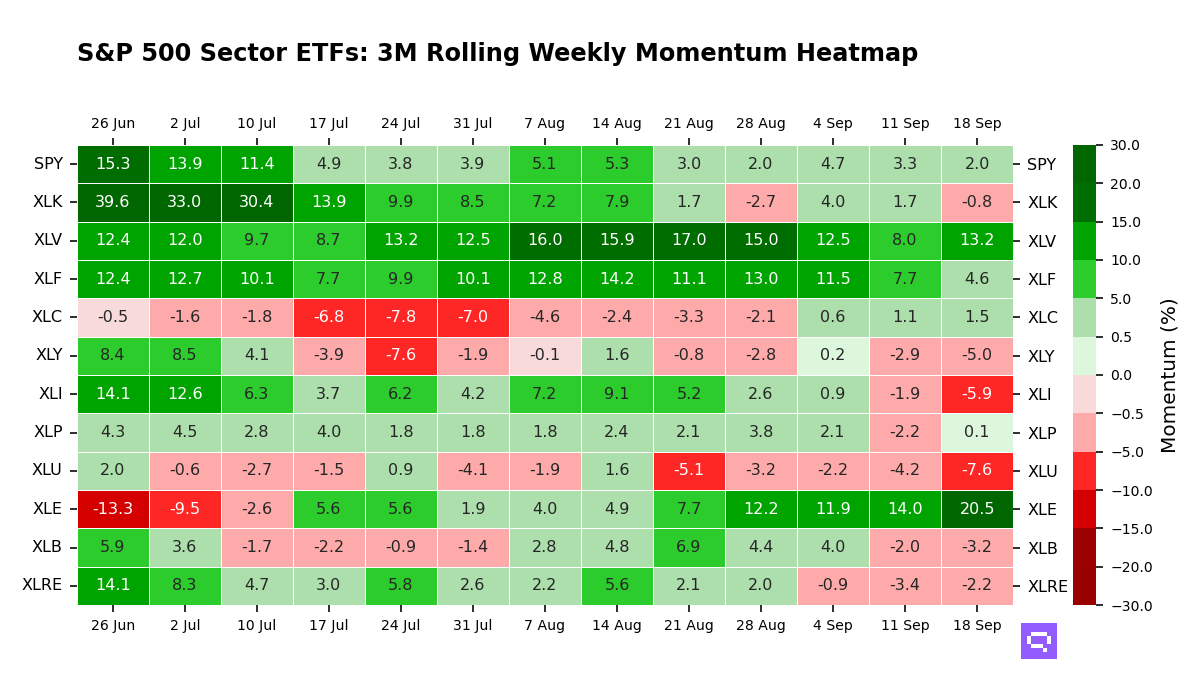
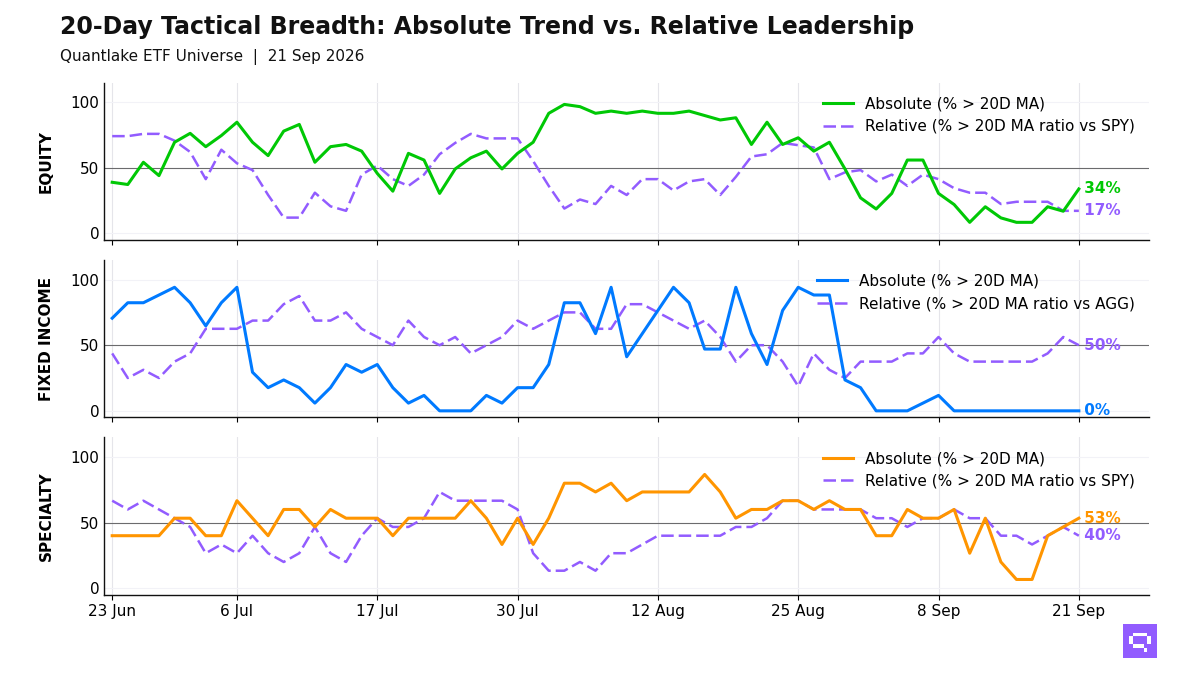
Equity participation in the ETF universe leans toward emerging markets and US growth at the close on September 21, with 20 of 59 equity ETFs (34%, +17.0pp on the day) above their 20-day moving average (20D MA) and 10 of 58 (17%, unchanged) above their ratio MA vs the S&P 500 SPY. Emerging markets EEM and Communication Services XLC added confirmed price and ratio cross-ups. Low-volatility, small-cap US, and developed ex-US form the laggard cluster.
Fixed income shows no price participation, with 0 of 17 ETFs above their own 20D MA. Relative winners vs the Aggregate Bonds AGG are limited to credit, international aggregate, and long duration. Treasuries, mortgage-backed, and inflation-linked funds lag.
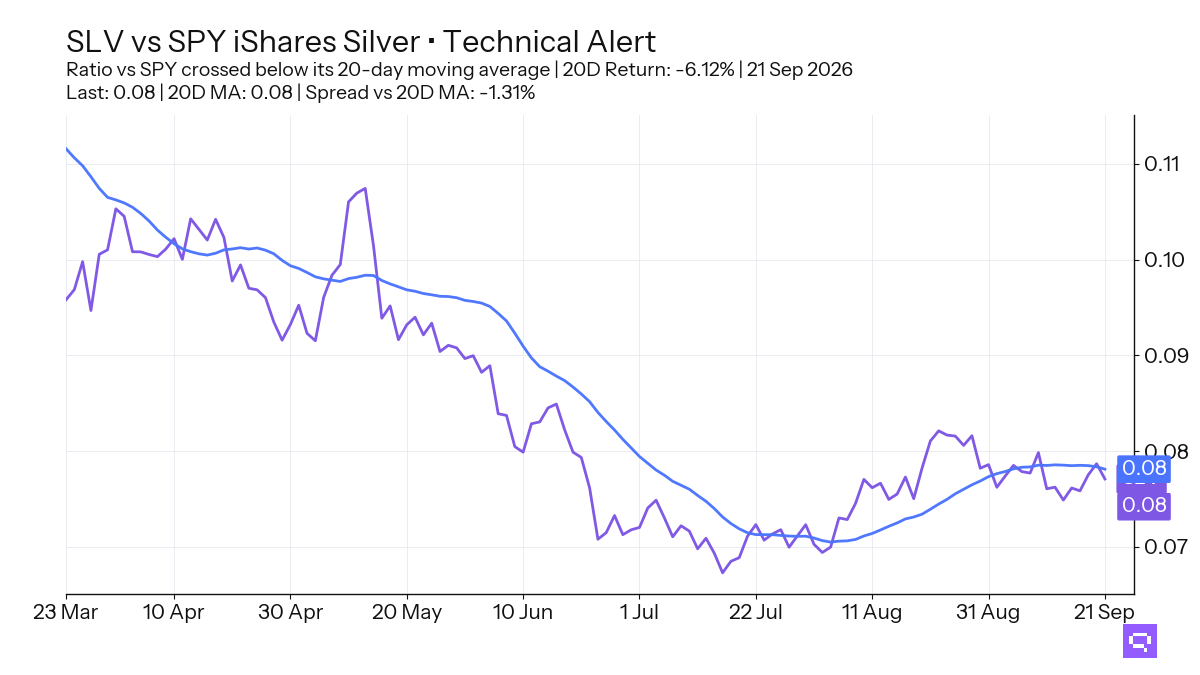
Specialty relative leadership vs the S&P 500 SPY centers on crypto-linked funds, semiconductors, and momentum. Long/short equity and clean energy trade above their own 20-day averages and below their ratio MA vs SPY. Silver SLV crossed below its ratio MA vs the S&P 500 SPY.
20-Day Tactical Breadth
Key Takeaways
Intl Momentum IMTM, China MCHI, and Quality Factor QUAL crossed above their own 20-day averages and each stays below its ratio MA vs the S&P 500 SPY. Japan EWJ crossed below its ratio MA vs SPY after a 1.63% 20-day relative gain.
Fixed-income alignment is 88%. Credit, international aggregate, and long duration populate the relative leader side vs the Aggregate Bonds AGG from below their own price averages. Short TIPS VTIP crossed below its ratio MA vs AGG.
Broad Commodities PDBC crossed below its ratio MA vs the S&P 500 SPY. Silver SLV crossed below its 20-day ratio moving average vs SPY (20D ratio MA vs SPY) after a 6.12% relative decline over the trailing 20-day window. Crypto-linked funds and semiconductors anchor the specialty relative leader cluster.
FEATURED ETF: iShares Silver SLV vs SPY
Other Technical Signal Events
Equity: Price vs 20-day MA
| Signal | Ticker | Name | 20D perf |
|---|---|---|---|
| Cross-up | MCHI | iShares MSCI China ETF | -2.98% |
| Cross-up | IMTM | iShares MSCI Intl Momentum Factor ETF | -0.74% |
| Cross-up | QUAL | iShares MSCI USA Quality Factor ETF | unch. |
| Cross-up | VLUE | iShares MSCI USA Value Factor ETF | +0.19% |
| Cross-up | URTH | iShares MSCI World ETF | +0.30% |
| Cross-up | VT | Vanguard Total World Stock Index ETF | +0.33% |
| Cross-up | VTI | Vanguard Total Stock Market Index ETF | +0.76% |
| Cross-up | VWO | Vanguard FTSE Emerging Markets Index ETF | +1.33% |
| Cross-up | EEM | iShares MSCI Emerging Markets ETF | +2.55% |
| Cross-up | XLC | Communication Services Select Sector | +3.35% |
| Cross-down | XLE | Energy Select Sector | -1.27% |
Equity vs SPY: Price Ratio vs 20-day MA
| Signal | Ticker | Name | 20D rel perf |
|---|---|---|---|
| Cross-up | EEM | iShares MSCI Emerging Markets ETF | +1.26% |
| Cross-up | XLC | Communication Services Select Sector | +2.05% |
| Cross-down | EWJ | iShares MSCI Japan ETF | +1.63% |
| Cross-down | XLE | Energy Select Sector | -2.51% |
Fixed Income vs AGG: Price Ratio vs 20-day MA
| Signal | Ticker | Name | 20D rel perf |
|---|---|---|---|
| Cross-down | VTIP | Vanguard Short-Term Inflation-Protected Securities Index ETF | unch. |
Specialty: Price vs 20-day MA
| Signal | Ticker | Name | 20D perf |
|---|---|---|---|
| Cross-up | ICLN | iShares Global Clean Energy ETF | +1.17% |
Specialty vs SPY: Price Ratio vs 20-day MA
| Signal | Ticker | Name | 20D rel perf |
|---|---|---|---|
| Cross-down | FTLS | First Trust Long/Short Equity ETF | +0.18% |
Commodities vs SPY: Price Ratio vs 20-day MA
| Signal | Ticker | Name | 20D rel perf |
|---|---|---|---|
| Cross-down | PDBC | Invesco Optimum Yield Diversified Commodity Strategy No K-1 ETF | +2.93% |
| Cross-down | SLV | iShares Silver | -6.12% |
Romain Gandon
CEO, Quantlake
Disclaimer: This article is for informational and educational purposes only and does not constitute investment advice. Past performance is not indicative of future results.