.png)
Quantifying Market Psychology: The Herd Index Advantage
Introducing the Quantlake Herd Index™ (QHI): A Behavioral Lens for Market Sentiment
In the vast landscape of investing, emotion often clouds judgment at the most critical moments. At Quantlake, we believe navigating these emotional tides systematically is key to long-term success.
That’s why we’re announcing the launch of our first proprietary metric: the Quantlake Herd Index™ (QHI), a behavioral risk sentiment composite designed to identify extremes in market psychology across the U.S. financial ecosystem.
The Science Behind the Herd
Markets, at their core, are driven by human behavior.
- When fear grips investors, selling pressure intensifies.
- When greed takes hold, buying accelerates.
This collective behavior, the herd, creates predictable patterns, extensively documented in academic research.
The QHI distills these behavioral patterns into a single, actionable metric by aggregating signals across multiple market dimensions:
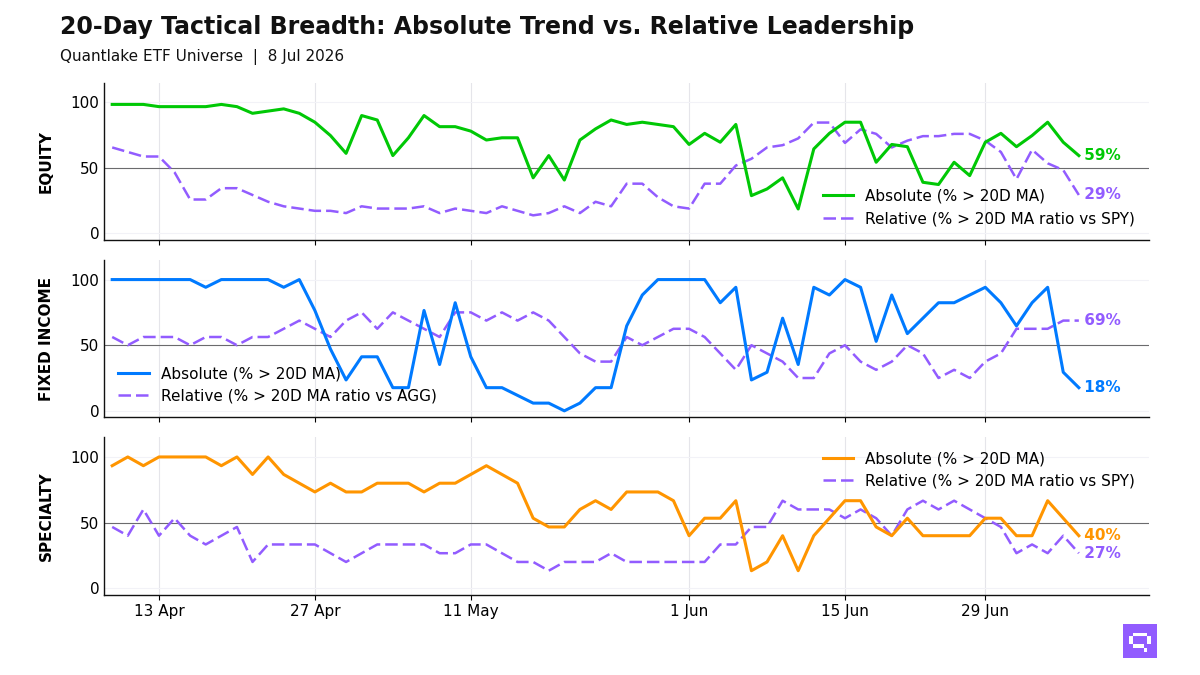
- Large-cap U.S. equity momentum
- Equity breadth and concentration risk
- Demand dynamics in high-yield and investment-grade bonds
- Implied volatility measures
- Risk appetite signals in credit spreads
Why Sentiment Matters: The Academic Evidence
The predictive power of sentiment indicators is well-established:
- Barberis and Thaler (2003) demonstrated how psychological biases create market inefficiencies exploitable by systematic investors.
- Pennycook and Rand (2019) found that crowd behavior leads to systematic mispricing.
- Baker and Wurgler (2007) showed that low sentiment periods are followed by higher future returns, particularly for volatile and growth-oriented stocks.
In short, extremes in sentiment often precede reversals, a phenomenon the QHI seeks to systematically capture.
How the QHI Works
Unlike single-factor sentiment indicators, the QHI synthesizes multiple behavioral signals across different asset classes:
- Aggregation: Diverse signals reflecting different aspects of investor mood.
- Normalization: Standardized to ensure fair contribution across inputs.
- Composite Output: A reading from 0 (extreme fear) to 100 (extreme greed).
The result?
A robust cross-asset behavioral barometer designed to help long-term investors identify periods of excessive fear and excessive complacency.
To ensure the robustness of our QHI, we developed the index construction methodology using in and out of sample data to guard against look-ahead bias and ensure QHI captures genuine market dynamics rather than data artifacts.
Our construction methodology remained fixed throughout the testing period with no retrospective adjustments.

QHI Availability
The Quantlake Herd Index™ will be available in Quantlake newsletters and through our official social media channels. Stay tuned for updates and regular insights based on the QHI!
QHI Zones and Forward Returns: The Data Speaks
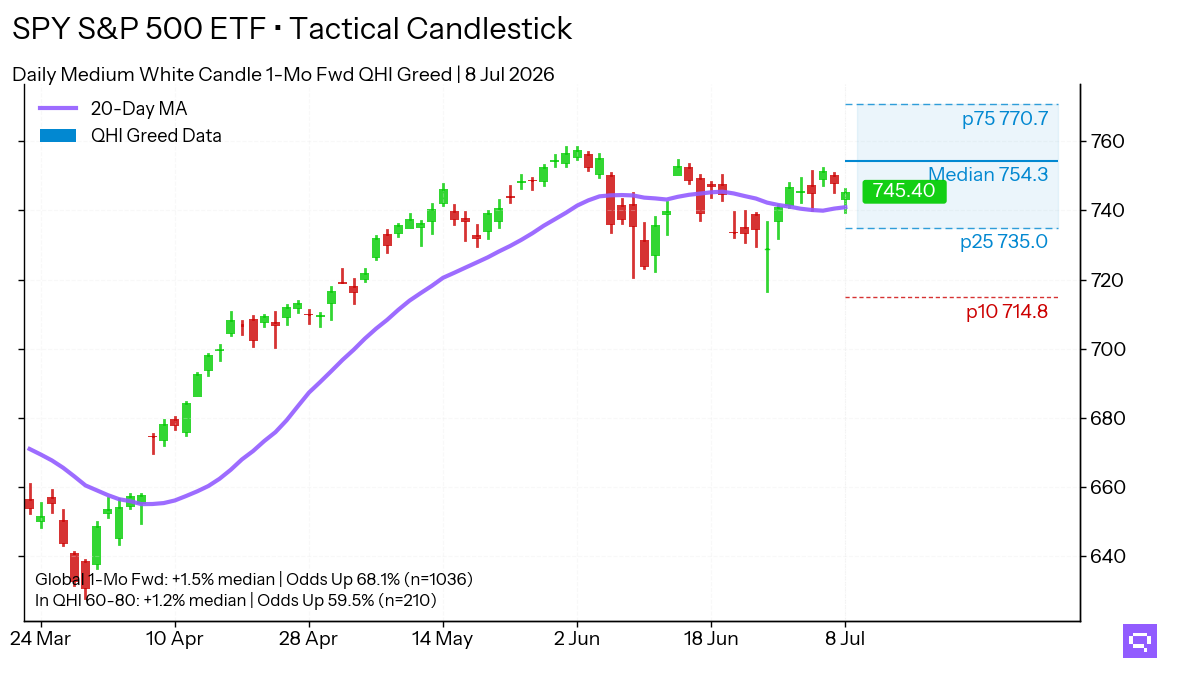
Our US equity market (SPDR S&P 500 ETF Trust - SPY) backtesting [2009 - 2025] confirms the contrarian nature of sentiment extremes:
The returns presented above are the actual S&P 500 ETF (SPY) returns following different QHI readings, these are benchmark returns, not excess returns or alpha.
For context, during our backtest period, the average 3-month SPY return was approximately 3.5%.
This means extreme fear readings were associated with above average future market performance, while extreme greed readings typically preceded below average returns.
Key Observations:
- Extreme Fear (QHI 0–20) zones have historically delivered 5.75% average 3-month forward returns with an 85.7% hit ratio.
- Extreme Greed (QHI 80–100) periods lead to much lower forward returns (1.57% on average) and hit ratios falling to just 62.5%.
=> Fear creates opportunity.
=> Greed demands caution.

Statistical Significance and Economic Meaning
To formally test the predictive power of the QHI:
- Parametric (T-Test) and Non-Parametric (Mann-Whitney U Test) both strongly rejected the null hypothesis that returns are similar across low and high QHI periods.
- p-values < 0.001, meaning the differences were statistically significant.
We also quantified the magnitude of the effect:
- Effect Size: (Cohen’s d = 0.53)
Cohen's d is a statistical measure that quantifies the size of the difference between two groups.
In this case, it measures the magnitude of difference between returns following low QHI periods versus high QHI periods.
A Cohen's d of 0.53 is considered a medium to large effect in behavioral finance research, indicating that the difference is not just statistically significant but also meaningful enough to have a real impact on investment outcomes.
While our analysis shows a strong statistical relationship between QHI extremes and subsequent returns, we acknowledge this doesn't necessarily imply direct causation.
Market returns following sentiment extremes may be influenced by multiple factors including:
- Monetary policy shifts
- Economic data releases
- Mean reversion in valuation multiples
- Shifts in institutional positioning
Practical Applications for ETF Investors
How you can integrate QHI into your long-term investing:
- Strategic Entry Points: Deploy capital during "Extreme Fear" zones where history suggests the best opportunities arise.
- Emotional Guardrails: Counter natural investor biases with objective behavioral data.
- Tactical Tilts: Slightly scale exposure to risk assets based on extreme QHI readings.
- Disciplined Rebalancing: Use the QHI as one input to reinforce strategic portfolio management and review.
The key is systematic integration, not emotional reaction.
Our Philosophy: Quantitative Discipline for Every Investor
At Quantlake, we believe the investing journey should be:
- Disciplined, not reactive
- Patient, not emotional
- Systematic, not speculative
The QHI embodies this philosophy, serving as a behavioral compass to help you recognize emotional extremes and act thoughtfully.
We’re here to make investing smarter, simpler, and less stressful.
Looking Forward
The launch of the Quantlake Herd Index™ marks a major step in bringing institutional-grade behavioral analysis to all investors.
Because the herd will always move between fear and greed.
With the right tools, you can make these emotional cycles work to your advantage.
In the coming months, we'll release additional proprietary indices to support investment decisions.
Stay systematic. Stay ahead.
Romain Gandon, CEO & Founder of Quantlake
🔗 LinkedIn