.png)
Weekly Momentum: Technology Breaks Out While Energy Holds Lead
Leadership Is Narrow but Recovery Breadth Improved
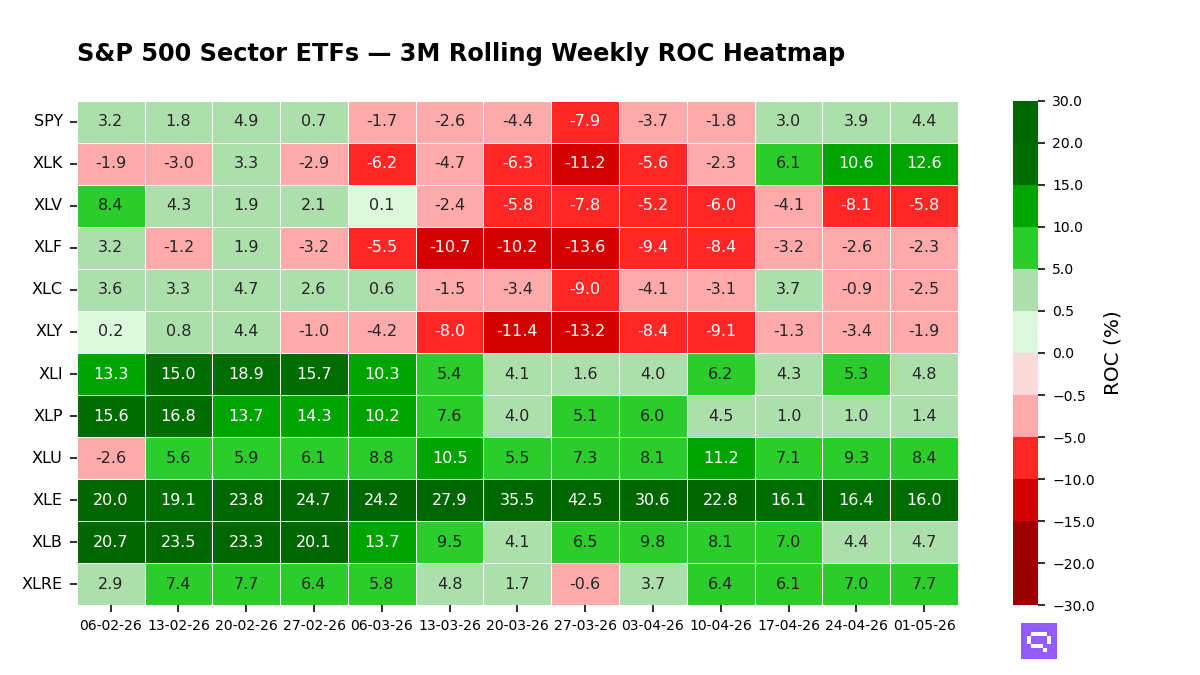
Energy (XLE) led at 16.0% three-month momentum — the rate at which price has changed over the past 13 weeks — down 0.4 point on the week. Breadth (the share of ETFs with positive momentum) improved to 63.6%, with 7 of 11 sectors above zero. Leadership remained narrow as a handful of winners carried the tape while several cyclical and defensive groups stayed below the neutral threshold.
XLK Breaks Out Even as XLC Stays Weak
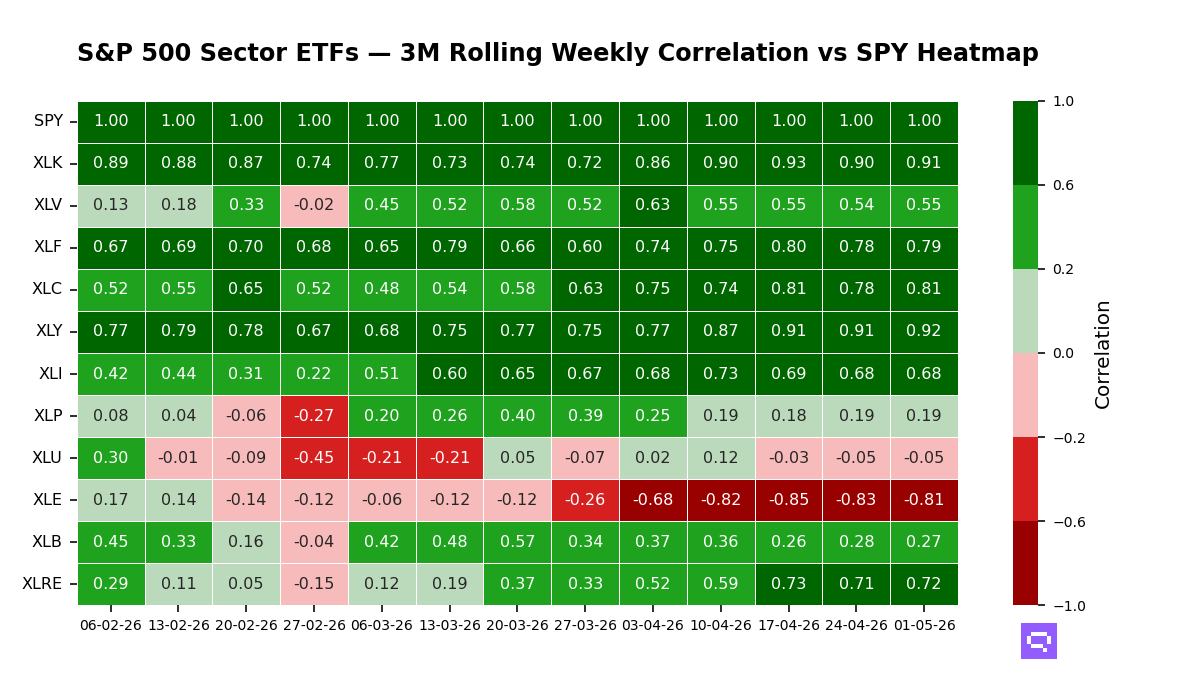
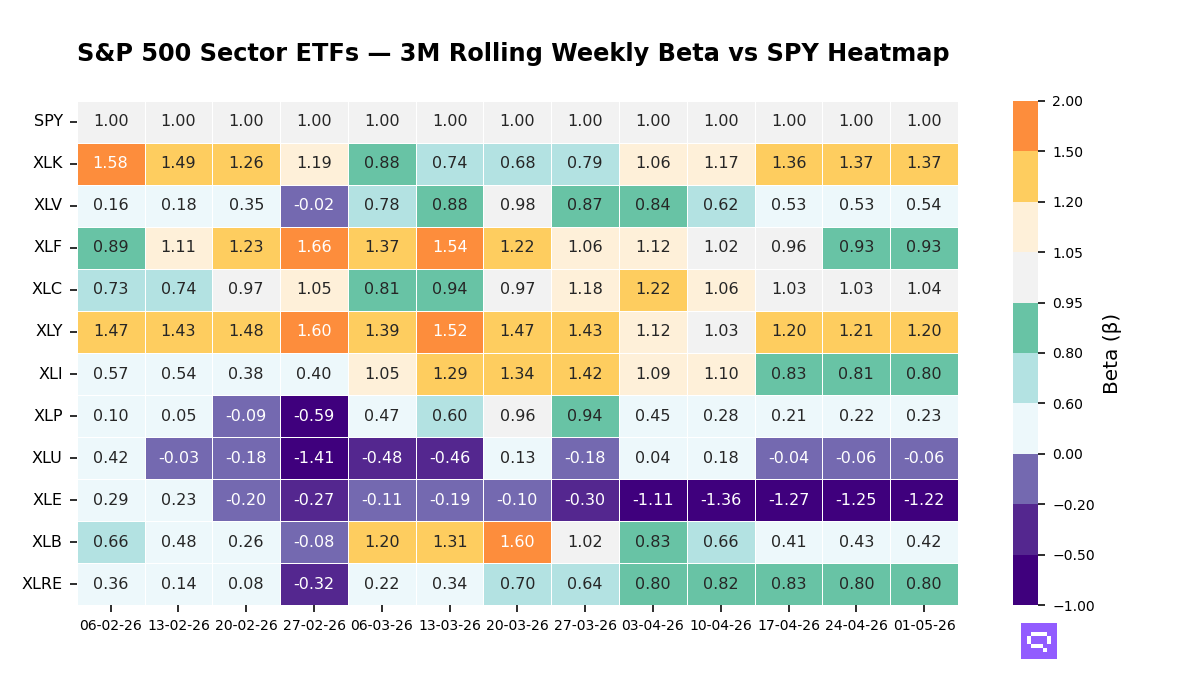
Technology (XLK) strengthened to 12.6%, up 2.0 points, in a breakout (three-month momentum above the peer median and accelerating relative to peers). XLK carries a 13-week rolling beta of 1.37 and correlation of 0.91 to SPY, confirming an amplified move that stayed tightly aligned with the broad market. Real Estate Sector (XLRE) held in strongly positive territory at 7.7%, up 0.7 point, near its own 1-year high. Utilities (XLU) eased to 8.4%, down 0.9 point, still positive but showing velocity exhaustion (a slowdown in the pace of weekly momentum gains). XLU carries a beta of -0.06 and correlation of -0.05 to SPY over 13 weeks, leaving it largely detached from equity moves.
Energy (XLE) remained the top-ranked sector even as momentum decelerated. XLE carries a beta of -1.22 and correlation of -0.81, marking it as consistently moving against SPY. Industrials (XLI) sat near the middle at 4.8%, down 0.5 point, and Materials (XLB) held at 4.7%, up 0.3 point, both near mid-range in their own histories.
Healthcare (XLV) improved to -5.8%, up 2.3 points, but remained deep in negative territory after a steep prior slide. XLV carries a beta of 0.54 and correlation of 0.55, leaving it moderately aligned with the market at lower amplitude. Consumer Discretionary (XLY) rose to -1.9%, up 1.5 points. Communication Services (XLC) fell further to -2.5%, down 1.6 points, in a breakdown (three-month momentum below the peer median and decelerating relative to peers). XLC carries a beta of 1.04 and correlation of 0.81, leaving it broadly market-paced even as it lagged within a still-positive equity backdrop.
Momentum Heatmaps
S&P 500 Sector Momentum
Beta & Correlation vs SPY — 3M Rolling
S&P 500 Sectors — Correlation vs SPY
S&P 500 Sectors — Beta vs SPY
Romain Gandon
CEO, Quantlake
Disclaimer: This article is for informational and educational purposes only and does not constitute investment advice. Past performance is not indicative of future results.