.png)

S&P 500 Sector Rotation in Standard Regime — Where Leadership Stands
Sector dispersion measures how widely S&P 500 sectors are diverging from one another — a key input for deciding whether active rotation or broad index exposure is the higher-value play. At May 1's close, the dispersion Z-score stands at -0.58 (deviation from its 60-day mean, scaled by GARCH volatility) — below its long-run average but within normal bounds. Normal territory spans Z-scores between -1.0 and +1.0, where no extreme compression or expansion is creating a structural edge in either direction, so velocity shifts between rotation quadrants are the primary signal worth tracking. Technology and Real Estate are the current momentum leaders. Industrial is the biggest mover, having dropped from rank 4 to rank 10 over the past month.
Sector Rotation Map
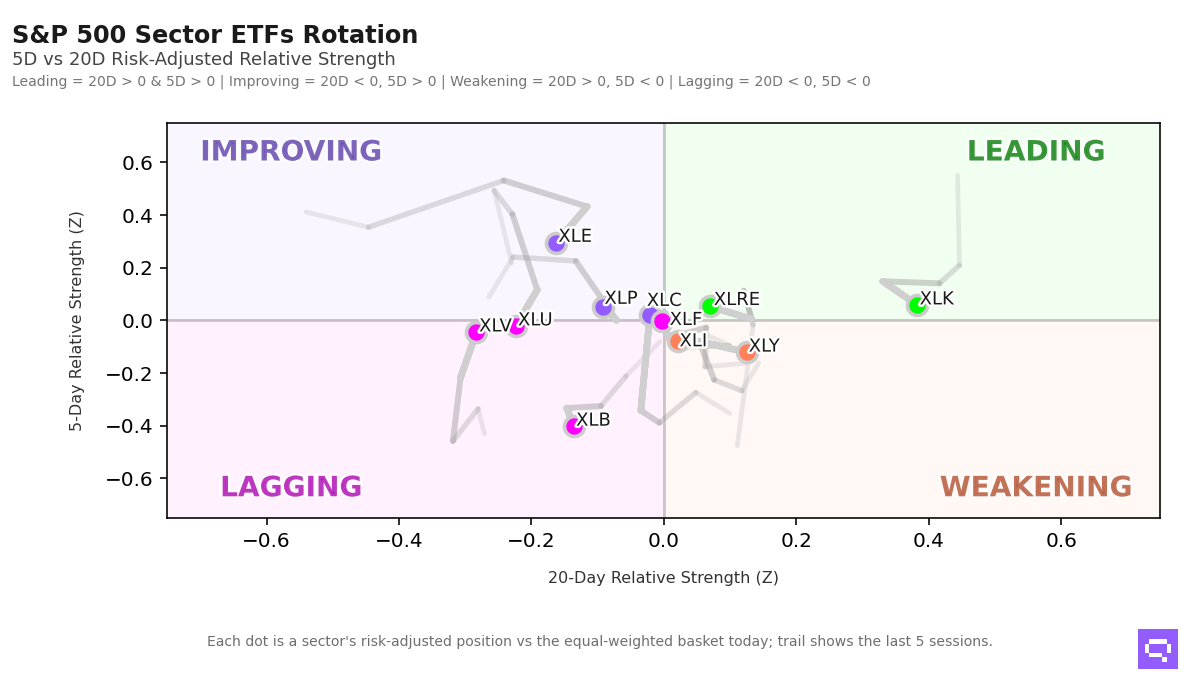
Alpha Z: risk-adjusted relative strength vs the equal-weighted S&P 500 sector basket (Z-score). Velocity: rate of change in short-term relative strength (1D vs 5D Z-score delta — tactical momentum). Structural velocity: smoothed 5D vs 20D momentum delta, reflecting regime-level directional shifts.
Momentum Leaders
• Technology — Rank #1 | Alpha Z: +1.40 | Velocity: +1.34
• Real Estate — Rank #5 | Alpha Z: +0.06 | Velocity: +0.00
Rotation Warnings
• Industrial — Rank shift (1D vs 5D): -1 | Structural velocity: -0.10
• Financial — Rank shift (1D vs 5D): -1 | Structural velocity: +0.00
Mean Reversion Candidates
• Communication Services — Alpha Z: +0.49 | Velocity: +0.46
• Consumer Staples — Alpha Z: +0.06 | Velocity: +0.01
• Materials — Alpha Z: -0.00 | Velocity: +0.40
Romain Gandon
CEO, Quantlake
Disclaimer: This article is for informational and educational purposes only and does not constitute investment advice. Past performance is not indicative of future results.